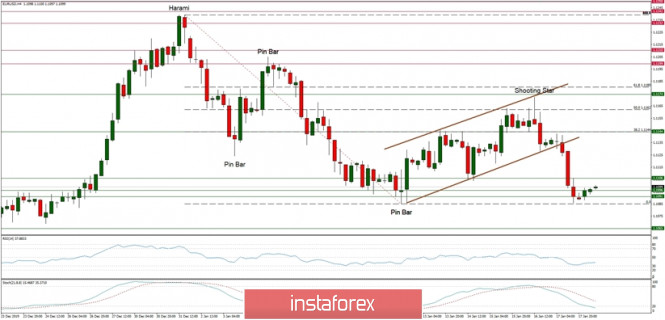
Technical Market Overview:
The EUR/USD pair has broken out form the short-term ascending channel around the level of 1.1127 after the Shooting Star candlestick pattern had occurred around the level of 1.1162 (50% Fibonacci retracement as well). Since then the market has hit the key short-term technical support located at the level of 1.1085, but so far the bulls defended the level and the price has bounced slightly towards the level of 1.1106. Nevertheless, the momentum is still weak and negative and the market conditions are too far away to be called oversold yet, so if the bulls will not bounce harder towards the technical resistance located at the level of 1.1127, then the odds for the down move are high.
Weekly Pivot Points:
WR3 - 1.1216
WR2 - 1.1193
WR1 - 1.1130
Weekly Pivot - 1.1046
WS1 - 1.1042
WS2 - 1.1019
WS3 - 1.0955
Trading recommendations:
Not much has changed since the last week in a bigger perspective. Still, the best strategy for current market conditions is to trade with the larger timeframe trend, which is down. All upward moves will be treated as local corrections in the downtrend. The downtrend is valid as long as it is terminated or the level of 1.1445 clearly violated. There is an Ending Diagonal price pattern visible on the larget timeframes that indicate a possible downtrend termination soon. The key short-term levels are technical support at the level of 1.1040 and the technical resistance at the level of 1.1267.

