To open long positions on EURUSD you need:
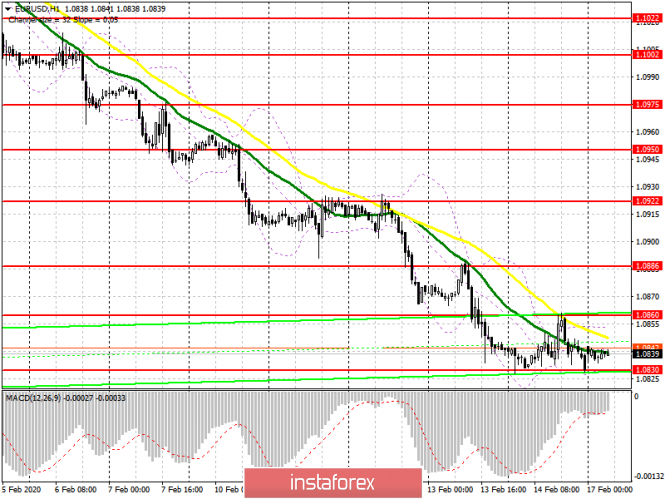
What awaits us today throughout the day is the Presidential day holiday in the United States and low trading volume. At the end of last week, weak data on industrial production in the US did not allow the bears to build up their short positions. However, it is unlikely that the situation with purchases of the euro will somehow improve, so all the attention again needs to be focused on the level of 1.0830, which I revised from Friday 1.0840. It is advised to be careful, bulls will only return to the market if a return to 1.0830 occurs with a false breakdown being formed there, thereby allowing them to reach the resistance of 1.0860, the break of which will lead the pair to a high of 1.0886, where I recommend taking profit. In case the euro falls further to long positions, you can look at the rebound from a low of 1.0804, or even lower, in the support area of 1.0773.
To open short positions on EURUSD you need:
The sellers formed a false breakout in the resistance area of 1.0860, not reaching the 1.0864 level, which only confirms the absence of those who wish to buy euros in the current conditions. However, the bears did not manage to break below the support of 1.0830, only having smeared the level of 1.0840, to which I paid attention last Friday. Today, euro sellers need a breakthrough of 1.0830, which will lead to further sales in the area of lows 1.0804 and 1.0773, where I recommend taking profits. However, given the lack of important fundamental statistics today, the Eurogroup meeting and US Presidential Day, we can expect a slight upward correction in EUR/USD to the resistance area of 1.0860, where an unsuccessful attempt to consolidate above this range will be the first signal to open short positions. You can sell the euro immediately for a rebound from a high of 1.0886.
Signals of indicators:
Moving averages
Trading is carried out in the region of 30 and 50 moving average, which indicates the likely formation of an upward correction.
Bollinger bands
Volatility has decreased, which does not provide signals on entering the market.

Description of indicators
- Moving average (moving average determines the current trend by smoothing out volatility and noise). Period 50. The graph is marked in yellow.
- Moving average (moving average determines the current trend by smoothing out volatility and noise). Period 30. The graph is marked in green.
- MACD indicator (Moving Average Convergence / Divergence - moving average convergence / divergence) Fast EMA period 12. Slow EMA period 26. SMA period 9
- Bollinger Bands (Bollinger Bands). Period 20
