EUR/USD
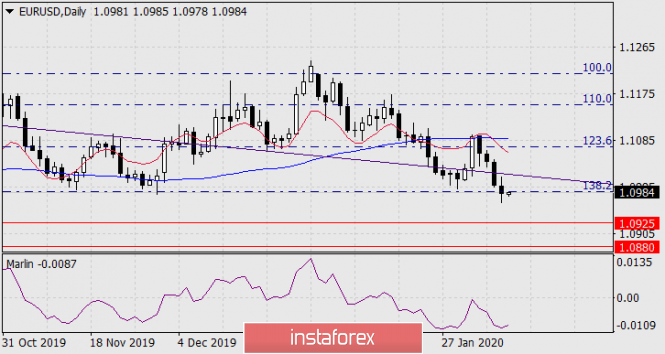
Yesterday, the euro managed to gain a foothold under the enclosed line of the price channel, which originates from the top of 2008. On the daily chart, the price also went under the Fibonacci reaction level of 138.2%.

Yesterday's publication of industrial orders in Germany for December showed a decrease of 2.1% against expectations of growth of 0.6%. In the US, the weekly report on applications for unemployment benefits showed 202 thousand such applications against the forecast of 215 thousand and 217 thousand a week earlier. The average monthly value of this indicator is 211.2 thousand. Taking into account the excellent data on employment in the private sector from ADP of 291 thousand and good employment sub-indexes in the ISM structure – 46.6 in the manufacturing sector and 53.1 in the non-manufacturing sector, there is a high chance that today's data on new jobs in the non-agricultural sector for January will come out better than the forecast. The forecast for the Non-Farm employment change is 163 thousand against 145 thousand in December. The forecast for wage growth is 0.3% compared to 0.1% a month earlier.

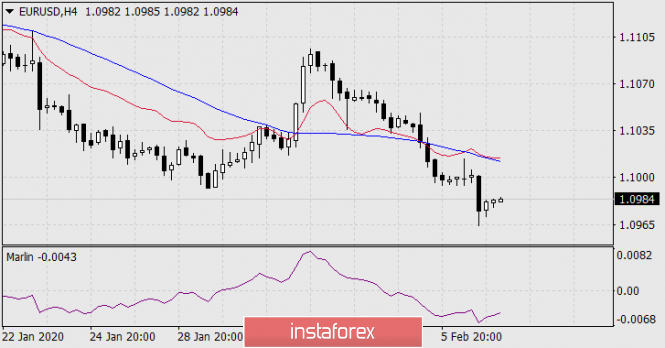
On a four-hour chart, the price drops below the indicator lines, and the Marlin oscillator goes deeper into the negative trend zone. The decline targets are visible on the daily chart: 1.0925 - minimum on September 3 and 12, 2019, and 1.0880 - minimum on October 1.
The material has been provided by InstaForex Company - www.instaforex.com