To open long positions on GBPUSD, you need:
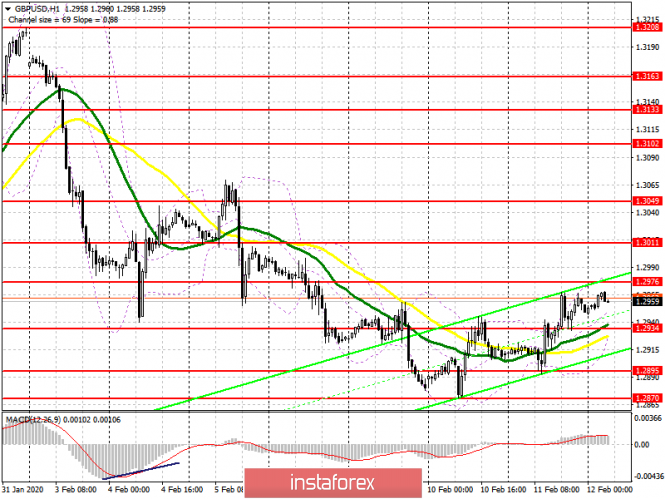
The British pound continued to recover in the second half of the day, taking advantage of good data on the growth of the UK economy at the end of last year, which will keep the probability of a rise at the beginning of this year. Currently, the bulls are focused on the resistance of 1.2976, the breakthrough of which will provide them with a new wave of growth of the pair in the area of the highs of 1.3011 and 1.3049, where I recommend taking the profits. However, bears won't just let the pound go, so in the case of a downward correction, one can look at long positions from the support of 1.2934, provided that there is a false breakdown up to the level of 1.2924, where the new lower boundary of the ascending channel was formed yesterday. The lack of demand in this range will collapse GBP/USD to the support of 1.2895, where you can open long positions immediately on the rebound, counting on correction of 20-30 points.
To open short positions on GBPUSD, you need:
The absence of important fundamental statistics can negatively affect sellers of the British pound, so I do not recommend rushing to short positions. Only the formation of a false breakdown in the first half of the day in the resistance area of 1.2976 will be a sell signal, which will lead to a downward correction to the support area of 1.2934-24, where the lower border of the new ascending channel passes. A break in this range will quickly push the pound to a minimum of 1.2895, where I recommend taking the profits. If the bears do not cope with the task of holding the resistance at 1.2976, it is best to return to short positions to rebound from the highs of 1.3011 and 1.3049.
Signals of indicators:
Moving averages
Trading is conducted above 30 and 50 moving averages, which keeps the probability of upward momentum in the pair.
Bollinger Bands
A break of the upper border of the indicator in the area of 1.2976 will lead to a new wave of pound growth. A break of the lower border of the indicator at 1.2925 will push the pound down.

Description of indicators
- Moving average (moving average determines the current trend by smoothing out volatility and noise). Period 50. The graph is marked in yellow.
- Moving average (moving average determines the current trend by smoothing out volatility and noise). Period 30. The graph is marked in green.
- MACD indicator (Moving Average Convergence / Divergence - Moving Average Convergence / Divergence) Fast EMA Period 12. Slow EMA period 26. SMA Period 9
- Bollinger Bands (Bollinger Bands). Period 20
