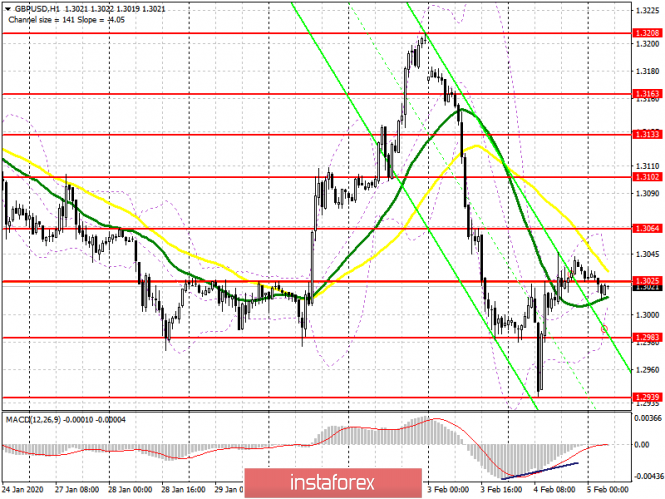
To open long positions on GBPUSD, you need:
After yesterday's major movements, today in the first half of the day, it is unlikely that anything will change significantly in the pair before the release of the report on the state of the UK service sector, which is an important component of the country's economy. It is expected that the index in January will remain at the same level of 52.9 points as in December last year. In the short term, the bulls are aimed at the resistance of 1.3025, a consolidation above which will be a powerful impulse to a new wave of growth of GBP/USD in the area of the highs of 1.3064 and 1.3102, where I recommend taking the profits. However, in the scenario of a pair's decline after a weak report on the service sector, new purchases can be considered after forming a false breakdown in the support area of 1.2983, which yesterday transformed from the level of 1.2990 and where a new lower border of the ascending channel can be built today. I recommend opening long positions immediately for a rebound only after testing the minimum of 1.2939.
To open short positions on GBPUSD, you need:
Despite the large fall in the pair, yesterday's rebound indicates that there are buyers in the market who are betting on further growth. Sellers will be forced to continue to defend the resistance at 1.3025 today. Short positions can only be opened from this resistance if a false breakdown is formed and weak data on the decline in activity in the UK services sector is available. Larger sellers are concentrated in the resistance areas of 1.3064 and 1.3102. An equally important task will also be to re-return and consolidate below the support of 1.2983, which also represents the lower border of the wide side channel. A break in this area will open a direct path to the lows of 1.2939 and 1.2896, where I recommend taking the profits.
Signals of indicators:
Moving averages
Trading is conducted in the area of 30 and 50 moving averages, which again indicates confusion with the direction before the release of important reports.
Bollinger Bands
A break of the upper border of the indicator at 1.3045 will lead to an increase in the pound, while a break of the lower border at 1.3005 will again increase the pressure on the pair.

Description of indicators
- Moving average (moving average determines the current trend by smoothing out volatility and noise). Period 50. It is marked in yellow on the chart.
- Moving average (moving average determines the current trend by smoothing out volatility and noise). Period 30. It is marked in green on the chart.
- MACD indicator (Moving Average Convergence/Divergence - convergence/divergence of moving averages) Fast EMA Period 12. Slow EMA Period 26. SMA Period 9
- Bollinger Bands (Bollinger Bands). Period 20
