4-hour timeframe

Technical details:
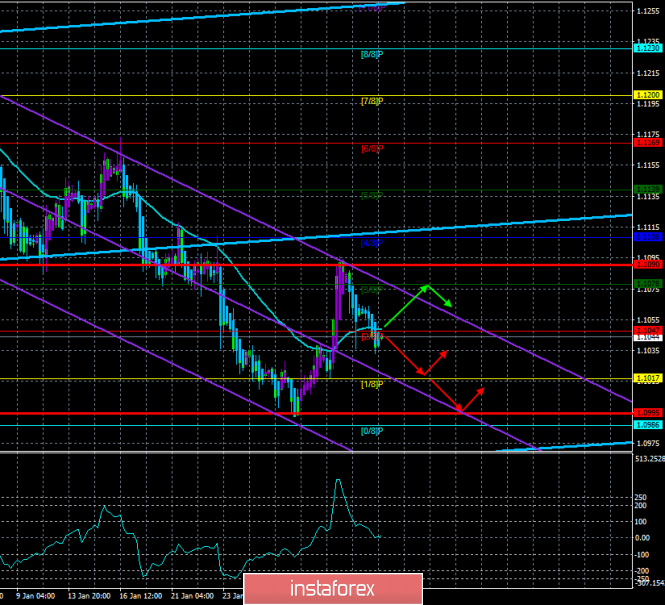
Higher linear regression channel: direction - upward.
Lower channel of linear regression: direction - downward.
Moving average (20; smoothed) - sideways.
CCI: 6.4103
The second trading day of the week was in a downward movement for the EUR/USD pair. By the end of the day, the quotes were fixed below the moving average line, so the upward trend changed to a downward trend. However, the "paradoxical situation" remains in effect, so when approaching local lows near the Murray level of "0/8" - 1.0986, the pair may turn around again, the bears may lose interest in the US currency, which will eventually provoke a new growth of the euro. Anyway, short positions have become relevant now.
If there were no macroeconomic statistics or other fundamental information available to traders on Tuesday, there will be plenty of it on Wednesday. As they say, there will be somewhere to roam. Unfortunately, most macroeconomic reports can be completely neutral, which will not affect the currency market. However, everything is in order. The day will start with the publication of business activity indices in the service sectors of Germany, the European Union, and some other major EU countries. Forecasts for these indicators are neutral, that is, they do not differ from the values of the previous month – December. Composite PMI indices for January with the same neutral forecasts will also be published. If we take the whole situation as a whole, business activity in the services sector causes much less concern for traders compared to the manufacturing sector. All indices of business activity in the service sector remain stable above the level of 50.0. So tomorrow, the numbers that show the good state of the industry can either be confirmed or not. However, in any case, a small deviation from the forecast values will not cause any reaction from traders. Only a serious discrepancy in the forecasts can provoke a strong movement of the euro/dollar pair.
Next, data on changes in the volume of retail trade in the European Union for December will be published. According to expert opinions, the indicator will grow by 2.3% y/y but will lose 0.5% every month. This is also a fairly minor indicator, which will cause a reaction from traders only if there is a strong discrepancy between the real value and the forecast value. And then there will be a speech by ECB President Christine Lagarde. And this is the key event of the day. Recall that at the January meeting of the regulator, no serious decisions were made. And Christine Lagarde's speech was so boring that the euro/dollar pair did not react at all to such an important event as the Central Bank meeting. Christine Lagarde continues to focus on the need for structural changes in the Central Bank itself and does not make any hints that the parameters of monetary policy may be changed soon. Moreover, there are no new factors that could force Lagarde to make a loud statement. Donald Trump is busy now completing the case for his impeachment and for some time forgot about the European Union and his desire to impose duties on the products of the European engineering sector. Global risks have eased a bit, but they haven't changed. No new and important information on an international scale has been received in recent weeks. Thus, Lagarde may devote his speech not to monetary policy, but, for example, to the risks associated with the new "coronavirus".
Important economic data will be published at the US trading session. First, this is the ADP report on changes in the number of employees in the private sector. Forecast - +150 thousand. Thus, the demand for the dollar after lunch will depend on the excess or absence of it. The business activity index for the services sector and the composite PMI from Markit will also be published. Both indicators are expected to be at the same level as the previous month, meaning no major changes are expected. And the most important and significant index of business activity in the service sector ISM will complete the day's publication of data. Experts expect a small increase to 55.1.
In general, we can say that the reaction of market participants to tomorrow's publications will depend entirely on the actual values of indicators and their compliance with forecasts. Since there is a lot of data, the ones where the discrepancy with the forecast will be the highest will be more important. And of course, Christine Lagarde's very important speech.
From a technical point of view, we expect the downward movement to continue, but a reversal of the Heiken Ashi indicator to the top may indicate at least an upward correction, and, at most, a resumption of the upward movement.

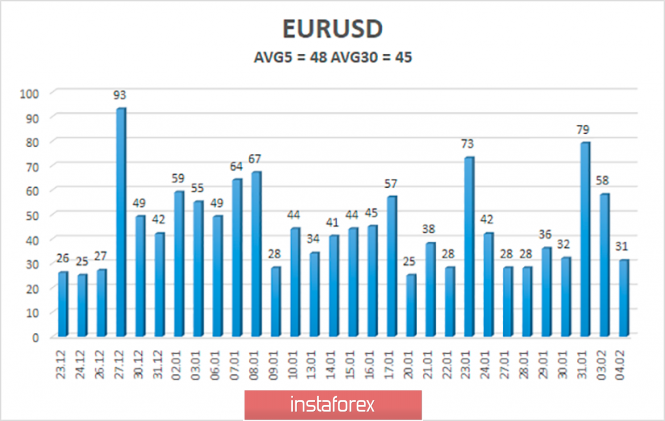
The average volatility of the euro/dollar currency pair has increased again and is now 48 points per day. Thus, on the third trading day of the week, we expect movement between the borders of the volatility range of 1.0995-1.1090. The pair will probably tend to work out the lower border if the Heiken Ashi indicator does not turn up at the very beginning of the day.
Nearest support levels:
S1 - 1.1017
S2 - 1.0986
S3 – 1,0956
Nearest resistance levels:
R1 - 1.1047
R2 - 1.1078
R3 - 1.1108
Trading recommendations:
The euro/dollar pair resumed its downward movement. Thus, sales of the euro currency with the goals of 1.1017 and 1.0995 are relevant now, before the Heiken Ashi indicator turns up. It is recommended to return to buying the EUR/USD pair not before the price is fixed back above the moving average line, which will change the current trend to an upward one, with the goals of 1.1078 and 1.1090.
In addition to the technical picture, you should also take into account the fundamental data and the time of their release.
Explanation of the illustrations:
The highest linear regression channel is the blue unidirectional lines.
The lowest linear regression channel is the purple unidirectional lines.
CCI - blue line in the indicator window.
Moving average (20; smoothed) - blue line on the price chart.
Murray levels - multi-colored horizontal stripes.
Heiken Ashi is an indicator that colors bars in blue or purple.
Possible price movements:
Red and green arrows.
The material has been provided by InstaForex Company - www.instaforex.com