4-hour timeframe

Technical data:
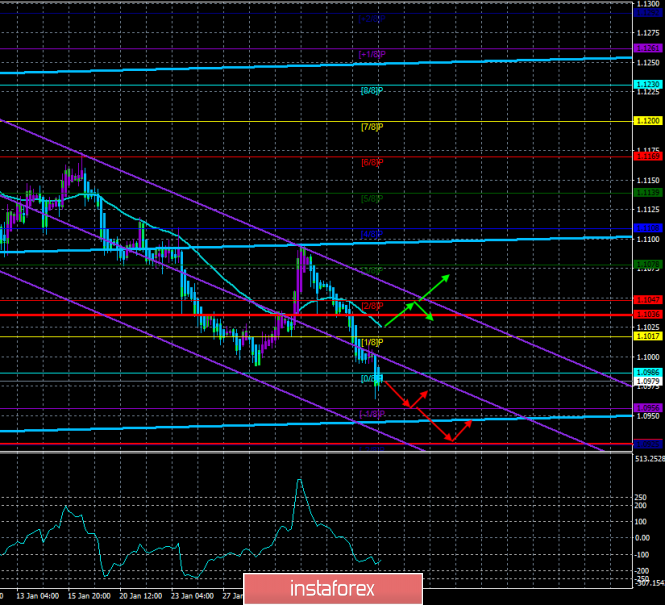
Higher linear regression channel: direction - upward.
Lower linear regression channel: direction - downward.
Moving average (20; smoothed) - down.
CCI: -158.6754
For the EUR/USD pair, the last trading day of the week begins with the continuation of the downward movement, as evidenced by the Heiken Ashi indicator. As we said in previous reviews, the pair raised into the 100-point zone before a two-year low of 1.0879. Thus, from our point of view, there is a high probability that another upward turn will be made in this zone with an increase of 100-200 points. This is how all approaches to two-year lows in recent times usually end. Moreover, if you look at the weekly chart of the euro/dollar pair, you can see that over the past 15 months, the loss of the euro currency is no more than 300-400 points, although all this time the downward trend is maintained. That is, every time the quotes approached their long-term lows, there was a pullback to the top and this continues for 15 months, the pair updates its lows by 20-30 points only from time to time, which, does not change the overall picture of the situation. Bears still pay little attention to fundamental factors, to macroeconomic statistics, when it comes to new sales at minimum price values.
Today, February 7, there is an opportunity to contribute to the fall of the European currency by another 50-60 points. In the morning, Germany will publish data on industrial production for December. Experts' forecasts indicate another reduction in volumes, but only by 0.2% monthly and by 4% on an annual basis. We believe that the actual cuts will be greater, but even if the forecasts are exceeded, it is unlikely that the euro currency will receive support from market participants from the report, which will record a drop in production volumes. No more important information is expected from the EU on this day. But it will publish extremely important data in the States. First of all, we are talking about NonFarm Payrolls – the number of new jobs created outside the US agricultural sector. According to experts' forecasts, their number in January will be 160,000, but we will be interested not in the ratio of the real value to the previous one (145,000), but the ratio to the forecast. Thus, exceeding the forecast value can provide serious support for the US currency. I still remember the previous Nonfarm report from ADP on the change in the number of employees in the private sector of the United States. It was much higher than the forecast value, making a record of 291,000 with a forecast of +157,000. However, it often happens that if the ADP report significantly exceeds the forecast, Nonfarm's are worse than expected. In any case, strong data from ADP does not mean that NonFarm Payrolls will also be strong. Also on Friday, data will be published on changes in average wages in annual and monthly terms and the unemployment rate for January, which is likely to remain at its lowest in several decades.
What can be predicted for today? Since the euro currency falls recklessly against the dollar for most of the week, it would be logical to see a correction on the last trading day of the week. However, given the strong fundamental background, everything will depend on it, and, in fact, on a single Nonfarm Payrolls report. On the other side of the scale, there are only potentially strong statistics from across the ocean. Therefore, we would say that the probability of continued downward movement today is no more than 33%.
The US dollar was also supported yesterday by Christine Lagarde, who openly made it clear to the markets that the economic situation in the eurozone may require new ECB interventions, which have at their disposal an extremely small number of working tools to stimulate economic growth. From a technical point of view, there are currently no signs of correction. Thus, up to the reversal of the Heiken Ashi indicator upwards, you can continue to remain in the sales of the euro/dollar pair.

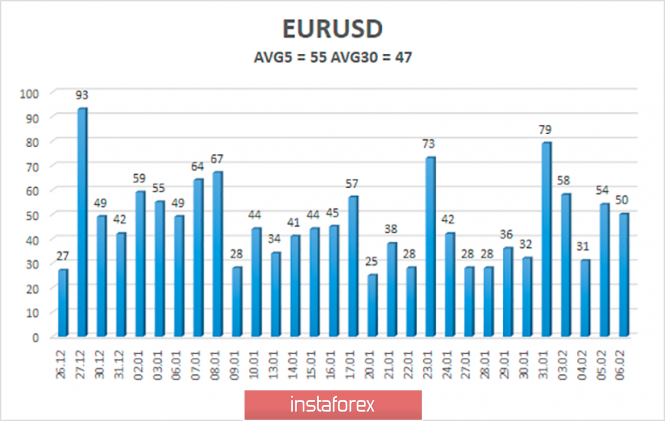
The average volatility of the euro/dollar currency pair has increased again and is now 55 points per day. Thus, on Friday, we expect movement between the borders of the volatility range of 1.0926-1.1036. However, most likely, a correction will begin, which can be determined by the reversal of the Heiken Ashi indicator to the top.
Nearest support levels:
S1 - 1.0956
S2 - 1.0925
Nearest resistance levels:
R1 - 1.0986
R2 - 1.1017
R3 - 1.1047
Trading recommendations:
The euro/dollar pair continues to move down. Thus, sales of the euro currency with the targets of 1.0956 and 1.0926 remain relevant now, until the Heiken Ashi indicator turns up. It is recommended to return to buying the EUR/USD pair not before the bulls cross the moving average line, which will change the current trend to an upward one, with the first targets of 1.1047 and 1.1078.
In addition to the technical picture, you should also take into account the fundamental data and the time of their release.
Explanation of the illustrations:
The highest linear regression channel is the blue unidirectional lines.
The lowest linear regression channel is the purple unidirectional lines.
CCI - blue line in the indicator window.
Moving average (20; smoothed) - blue line on the price chart.
Murray levels - multi-colored horizontal stripes.
Heiken Ashi is an indicator that colors bars in blue or purple.
Possible price movements:
Red and green arrows.
The material has been provided by InstaForex Company - www.instaforex.com