Hello dear traders!
In today's article on the "Canadian" currency, we will analyze the main technical differences of the USD / CAD currency pair, and try to find acceptable entry points for opening positions on this currency pair. Let's start with the results of last week.
Weekly

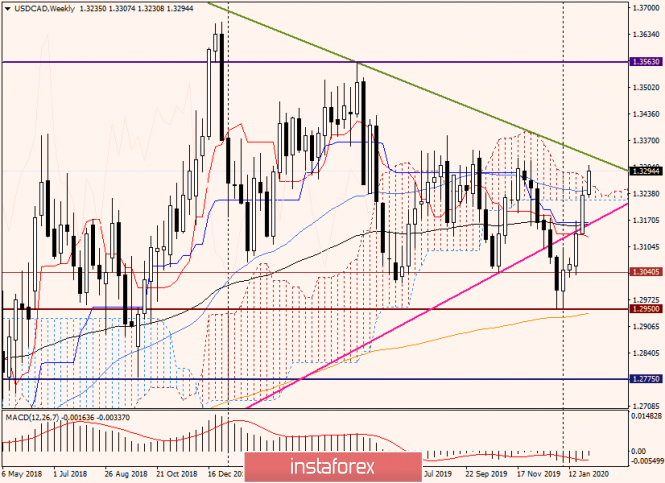
Last week, the pair showed growth and as a result of which, it returned above the seemingly broken pink support line 1.2061-1.3041. As expected, this line was already truly broken and the price consolidated underneath, but it was not there. As a result of a fairly decent growth, the pair broke the lines of the Tenkan and Kijun of the Ichimoku indicator, and they have with them the 89 exponential moving average, closing trading at 1.3233, which is located within the cloud of the Ichimoku indicator.
I believe that this is a good attempt to continue the upward trend. In this regard, USD/CAD confirms its intention to increase at the current weekly trading. Now, trading is carried out near the symbolic level of 1.3300, where the green line of resistance and the downward trend 1.4690-1.3563 passes a little higher.
Moreover, in case that there is a breakdown of this line and the quote consolidates above it, with a 99.9% confidence, then we can assume that buyers, i.e. bulls, have control over the pair.
Alternatively, in the case of a bearish reversal signal appearing under the designated line, the growth is likely to come to its end and USD/CAD will turn in a downward direction.
Daily

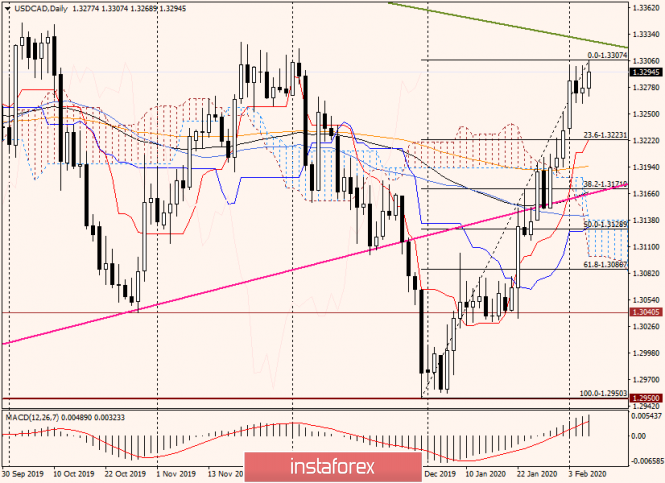
On the daily chart, it looks quite bullish. The Fibonacci grid for the current growth of 1.2950-1.3307 was stretched, and the rate to continue strengthening is expected. At least, there are no signals for a reversal or correction yet. Here, we have quite a decent upward trend.
Now, for the bulls in a pair, the main task will be to pass the green line of resistance - this will play a huge role in the future of USD/CAD. The breakdown and consolidation above will indicate an even more pronounced bullish scenario and higher growth goals.
If the trend changes in the pair or it reverses for correction, the nearest goal will be the level of 23.6 Fibo, where the Tenkan line of the Ichimoku indicator is also located. The farther targets below are the 200 exponent located at 1.3195, and the level of 1.3170, where 32.8 is Fibo, and the level 38.2 is slightly lower than the current growth.
H4

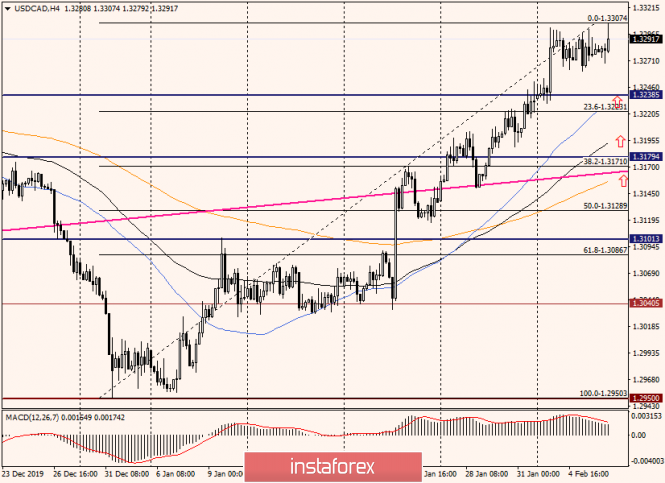
On the 4-hour timeframe, a bull trend is clearly expressed. In order not to discuss long and not paint the situation as it is taking time, I will turn to specific trading recommendations for USD/CAD.
Naturally, the main idea for trading on USD/CAD pair is to consider purchases, but not at the peak of the market, but after pullbacks and corrections, because of such a technical picture, which is already observed on three charts in a row, and, starting from the weekly.
Moreover, I propose to consider the opening of long positions in the pair near the levels: 1.3235, 1.3195, 1.3180 and 1.3165. In the event that the last level is broken and the course consolidates below it, we will consider sales, and then only after the presence of the corresponding signals of Japanese candlesticks.
So far, that's all for the technical side.
However, do not forget that there will be data on the labor market of the USA and Canada tomorrow at the same time at 13:30 (Universal time). I believe that these statistics will have a determining influence on the results of the current trading week, so it's too early for the bulls of USD/CAD to get excited.
See you soon!
The material has been provided by InstaForex Company - www.instaforex.com