4-hour timeframe

Average volatility over the past five days: 199p (high).
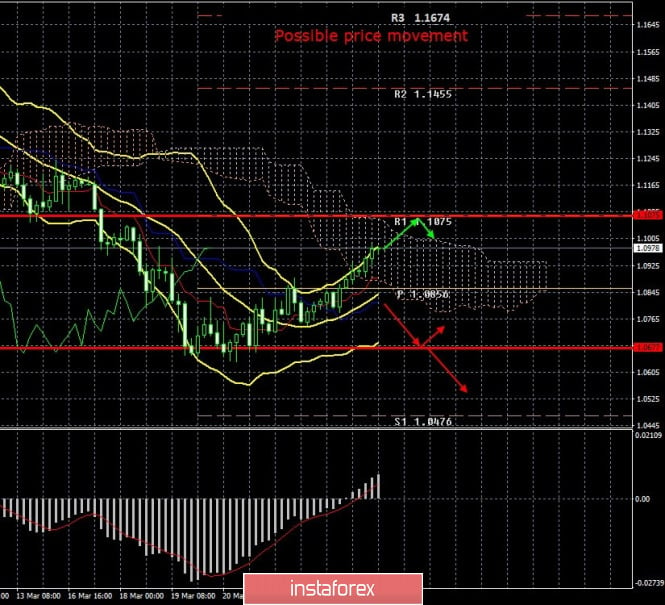
The EUR/USD pair ends the fourth trading day of the week by continuing growth, which was initially classified as a corrective movement, but now represents a full-fledged upward trend. We cannot say with absolute certainty that the downward course for the euro/dollar pair has ended. However, now everything looks exactly as if traders are sated with purchases of the US currency. After all, it is true that the US currency has been continuously rising in price for almost two weeks. There was only one reason – the coronavirus and the panic associated with it. But why did the dollar become more expensive? There can only be one answer. Traders firmly believed that the US economy would survive the crisis and the epidemic with complete calm, or at least with less losses than other countries. However, in practice, it turns out that the United States is not far behind the eurozone and even threatens to overtake it in the number of diseases and deaths from infection. The coronavirus first began to spread in the European Union, so it is not surprising that the largest number of infected people can be found there. Nevertheless, the United States adds 10-20% to their number of infected people every day. Moreover, the central banks of both the EU and the US simultaneously lowered rates to a minimum and resumed quantitative stimulus programs. However, the EU did not lower the rates. They have long been at ultra-low values. That is, the euro/dollar exchange rate at the time before the outbreak of the epidemic just took into account the fact that rates in the EU are much lower than in the United States. What happens next? The Federal Reserve lowers rates to zero, announces a huge program of quantitative stimulus, and yesterday passes a law that involves injecting $2 trillion additional into the economy. Yes, this is not a QE program, which involves the Fed buying securities from the open market. But these are the same incentives: helicopter money for the US population, cheap loans for small and medium-sized businesses, subsidies, grants, and assistance to the companies most affected by the epidemic and the shutdown. Thus, it was the US currency that should have weakened against other currencies, not the other way around. Well, if you also remember the collapses in the US stock market, record slumps, the problems of the US oil and gas sector, which will suffer due to low oil prices, it is not clear why the dollar was getting more expensive? And to all this, we now add the firm strengthening of the US currency in the period from March 9 to 19, and we get that the greenback is most overbought in the current conditions. That the demand for it is unreasonably high in the current reality and with the current balance of forces between the monetary policy of the ECB and the Fed. However, all these arguments are opposed by only one factor – the majority of market participants' faith in the dollar. And if traders decide to resume buying the US currency, despite the macroeconomic and fundamental background, the dollar will again become more expensive. However, while traders have not yet returned to unwarranted investments in the dollar, we would say that the euro has a good chance of fully recouping all losses over the past month.
The United States has just published a report on applications for unemployment benefits for the week of March 13-20. The indicator of the previous week already warned that everything is bad, and you need to prepare for the worst. Experts expected from 1 to 1.1 million new applications for benefits. However, the reality was slightly worse. The actual number of applications for one week was 3.283 million, while the normal value of the indicator is 220-230 thousand. And this is only for the first week of the epidemic raging. What will happen next? I immediately remember the words of the representative of the Monetary Committee of the Fed, James Bullard, who predicted unemployment at 30%. It seems that he is not far from the truth. As for the US currency, it continued to fall today, March 26. We cannot say that this was the market's reaction to the published report. However, most likely, this report also affected the decline in demand for the dollar. Volatility remains quite high today, but it is not as high as in the first weeks of the new crisis. About 110 points have been passed so far.
4-hour timeframe

Average volatility over the past five days: 351p (high).
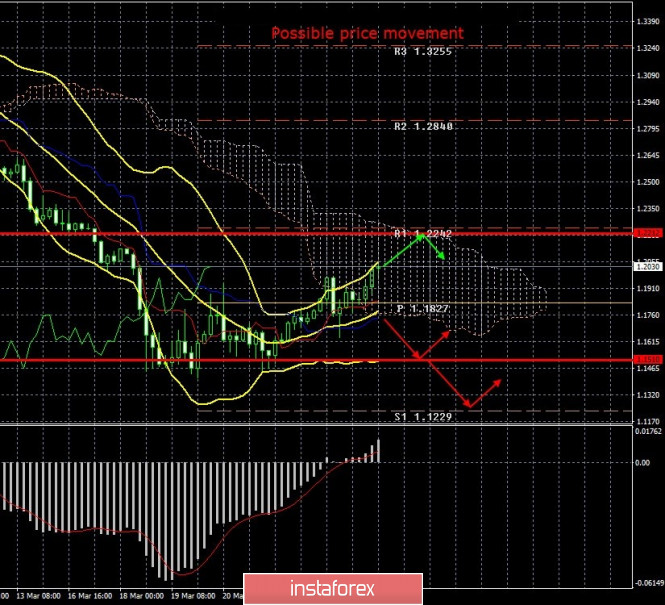
The GBP/USD currency pair resumed its upward movement on March 26, after the price rebounded from the Kijun-sen critical line. Thus, the movement continues towards the upper boundary of the Ichimoku cloud. The reasons for the pound's growth are now approximately the same as for the euro. Given the new reality, the new rates of the Fed and the Bank of England, new quantitative stimulus programs and new cash injections in each economy, the position of the British currency no longer looks hopeless. Yes, the aggravating factor in the form of Brexit in the form of negotiations on trade relations after Brexit between Brussels and London continues to hang over Britain and the pound. However, now this topic is no longer in the first place for traders and investors. Thus, if the US dollar will not be bought up by market participants simply because it is the dollar, then the pound will continue to recover with a high degree of probability. No matter how weak the pound is, we believe that losing 1,500 in two weeks is too much. Today, the pound/dollar pair has already passed about 260 points, but this value is likely to exceed 300 points by the end of Thursday. Thus, the average volatility will remain stably high.
Recommendations for EUR/USD:
For short positions:
The euro/dollar continues its upward movement on the 4-hour timeframe. Thus, it is advised that you should only sell the euro if the price is consolidated below the critical line with the first goal, the level of volatility is 1.0677. The second target is the support level of 1.0476.
For long positions:
Formally, you can buy the EUR/USD pair now, since the price has crossed the Kijun-sen line, with the first goal the resistance level is 1.1075. The chances of a recovery in the euro are growing, but the signal from the Ichimoku Golden Cross is still weak. Therefore, buy-positions only in small lots.
Recommendations for GBP/USD:
For short positions:
The pound/dollar pair resumed its upward movement, bouncing off the Kijun-sen line. Thus, it is recommended to sell the British pound with the goal of a volatility level of 1.1510 only after price taking below the Kijun-sen line. The second goal is the support level of 1.1229.
For long positions:
You can buy the GBP/USD pair now, since a rebound from the Kijun-sen line has been made, with the first goal, the level of volatility is 1.2212, but in small lots. Similar with the euro's case, it is advised that you keep in mind the increased risks when opening any positions.
Explanation of the illustration:
Ichimoku indicator:
Tenkan-sen is the red line.
Kijun-sen is the blue line.
Senkou Span A - light brown dotted line.
Senkou Span B - light purple dashed line.
Chikou Span - green line.
Bollinger Bands Indicator:
3 yellow lines.
MACD indicator:
Red line and bar graph with white bars in the indicators window.
Support / Resistance Classic Levels:
Red and gray dashed lines with price symbols.
Pivot Level:
Yellow solid line.
Volatility Support / Resistance Levels:
Gray dotted lines without price designations.
Possible price movements:
Red and green arrows.
The material has been provided by InstaForex Company - www.instaforex.com