To open long positions on EURUSD you need:
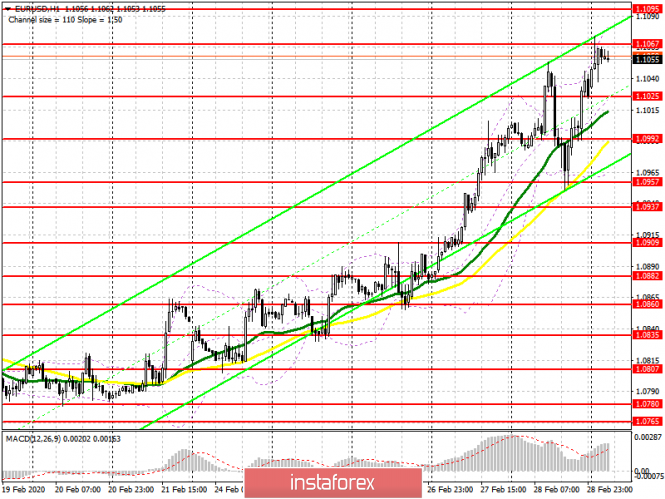
US stock markets continued to fall on Friday, while the likelihood of Federal Reserve intervention increased. Against this background, the risk of lower interest rates increased, which retained an upward momentum in the euro. Today, buyers will rely on good performance indicators in the eurozone countries, as well as a breakthrough and consolidation above the resistance level of 1.1067, which will open a direct path to the highs of 1.1095 and 1.1116, where I recommend taking profits. In the scenario of a downward correction against the background of bad data, and there is nothing good to expect from the eurozone production, I recommend returning to long positions when a false breakout is formed in the support area of 1.1025, or slightly lower from the level of 1.0992. Larger players will again wait for the test area of 1.0957, where there was a major surge in volume on Friday.
To open short positions on EURUSD you need:
I don't recommend that you hurry with selling the euro on such a large increase. Although the indicators speak of overbought, it is better to wait for the formation of a false breakout in the resistance area of 1.1067, or wait for the test of new highs in the areas of 1.1095 and 1.1116, where I recommend opening short positions immediately for a rebound. A breakout and consolidation under the support level of 1.1025 will be an equally important task for the bears, which will increase the pressure on the euro and return the pair to the lows of 1.0992 and 1.0957, where I recommend taking profits, since a new lower boundary of the current ascending channel can be formed in this range. The bad fundamental data on the eurozone is unlikely to move to the background the situation in the US stock market and the expectations of participants to reduce interest rates in the United States, but do not forget about the serious problems of the European economy.
Signals of indicators:
Moving averages
Trading is conducted above 30 and 50 moving averages, which indicates the likelihood of further upward correction of the euro. With a decrease in the pair, the moving averages will also act as support.
Bollinger bands
Growth will be limited by the upper level of the indicator in the region of 1.1085, while the lower boundary in the area of 1.0960 will provide support.

Description of indicators
- Moving average (moving average determines the current trend by smoothing out volatility and noise). Period 50. The graph is marked in yellow.
- Moving average (moving average determines the current trend by smoothing out volatility and noise). Period 30. The graph is marked in green.
- MACD indicator (Moving Average Convergence / Divergence - moving average convergence / divergence) Fast EMA period 12. Slow EMA period 26. SMA period 9
- Bollinger Bands (Bollinger Bands). Period 20
