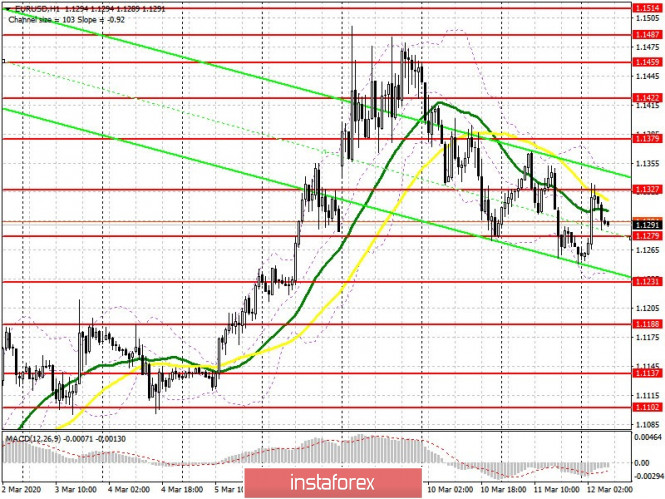
To open long positions on EURUSD, you need:
Yesterday's data on inflation in the US generally benefited the us dollar, but all the attention today will be on the decision of the European Central Bank on monetary policy. A reduction in deposit rates is expected, as well as an expansion of the bond-buying program, which may put pressure on the euro. With the current picture, buyers need to return to the resistance level of 1.1327, which can lead to an update of the level of 1.1379, and also allow them to reach the high of 1.1422, where I recommend taking profits. If pressure on the euro persists in the first half of the day, and the bulls will not be able to keep the pair above the support of 1.1279, then it is best to return to long positions at the test of the low of 1.1188, or buy immediately on a rebound from the support of 1.137.
To open short positions on EURUSD, you need:
It is likely that the market will go against the crowd, and after the ECB's decision, the bulls will try to return the pair to the highs of this month. If you break through the resistance of 1.1327, I recommend that you do not rush to open short positions, and it is best to wait for the ECB's decision and update the highs of 1.1379 and 1.1422, as well as the area of 1.1459, the higher the better. I recommend selling EUR/USD only from these levels, with small stop orders above. In the scenario of the bears returning to their support of 1.1279, the pressure on the pair will increase, which will lead to a test of the lows of 1.1231 and 1.1188, where I recommend profit taking before the decision of the European regulator is announced.
Indicator signals:
Moving averages
Trading is conducted below the 30 and 50 moving averages, which keeps the probability of a further downward correction in the pair.
Bollinger Bands
Before the ECB's decision is announced, the lower boundary of the indicator around 1.2131 will provide support, while growth will be limited to the upper level at 1.1355.

Description of indicators
- Moving average (moving average determines the current trend by smoothing out volatility and noise). Period 50. The graph is marked in yellow.
- Moving average (moving average determines the current trend by smoothing out volatility and noise). Period 30. The graph is marked in green.
- MACD indicator (Moving Average Convergence / Divergence - moving average convergence / divergence) Fast EMA period 12. Slow EMA period 26. SMA period 9
- Bollinger Bands (Bollinger Bands). Period 20
