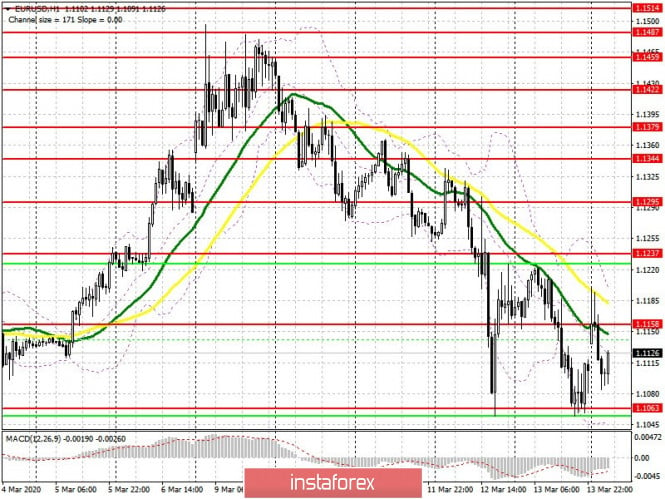
To open long positions on EURUSD, you need:
The decision of the Federal Reserve to lower interest rates to 0.25% and return to the crisis program of asset repurchase QE worth $700 billion did not frighten buyers of the US dollar, and after a slight gap in the morning, the pair began to slowly descend again to the support of 1.1063, which the bears have already tested twice recently. The return to a crisis-based system of market support points to serious problems in the economy that may begin after the coronavirus pandemic. Today, the task of the bulls for the first half of the day is to protect the level of 1.1063, the formation of a false breakout at which will be the first signal to open long positions in order to break and consolidate above the middle of the 1.1158 channel. Only from there can we expect an upward correction to the upper limit of 1.1237, where I recommend profit taking. In case there is no demand for the euro around the low of 1.1063, long positions are best postponed until the test of the larger levels of 1.0992 and 1.0957. However, I would not expect a strong rebound from these ranges. A maximum of 20-30 points within a day.
To open short positions on EURUSD, you need:
Judging by the Fed's decision and the lack of reaction in the market, the bearish trend will continue in the pair. Sellers need to form a false breakout in the resistance area of 1.1158, which will be a signal to open short positions. A more important goal will be a breakout and consolidation below the support of 1.1063, which will raise pressure on EUR/USD and lead to an update of the lows in the area of 1.0992 and 1.0957, where I recommend taking profits. Given the absence of important fundamental statistics and the Eurogroup meeting, the return of the bulls to the resistance of 1.1158 may lead to an upward correction of the pair to the high of 1.1237, from where I recommend opening short positions immediately on the rebound.
Indicator signals:
Moving averages
Trading is conducted below 30 and 50 moving averages, which keeps the probability of a further downward trend in the pair.
Bollinger Bands
In case the euro declines, the lower boundary of the indicator around 1.1063 will provide support , while the growth may be limited by the upper level of the indicator in the area of 1.194.

Description of indicators
- Moving average (moving average determines the current trend by smoothing out volatility and noise). Period 50. The graph is marked in yellow.
- Moving average (moving average determines the current trend by smoothing out volatility and noise). Period 30. The graph is marked in green.
- MACD indicator (Moving Average Convergence / Divergence - moving average convergence / divergence) Fast EMA period 12. Slow EMA period 26. SMA period 9
- Bollinger Bands (Bollinger Bands). Period 20
