To open long positions on EURUSD, you need:
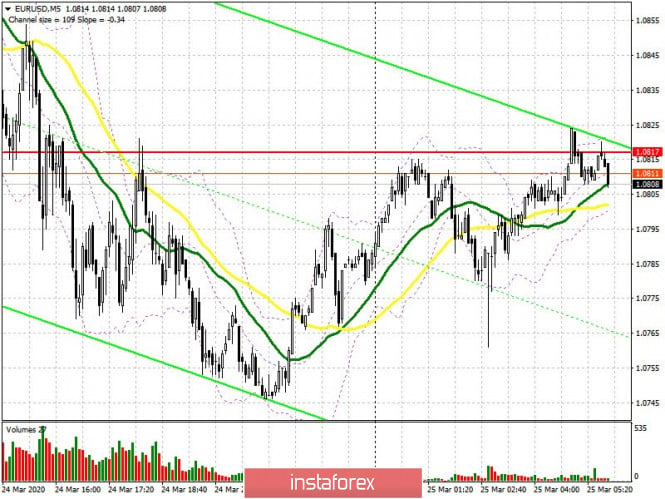
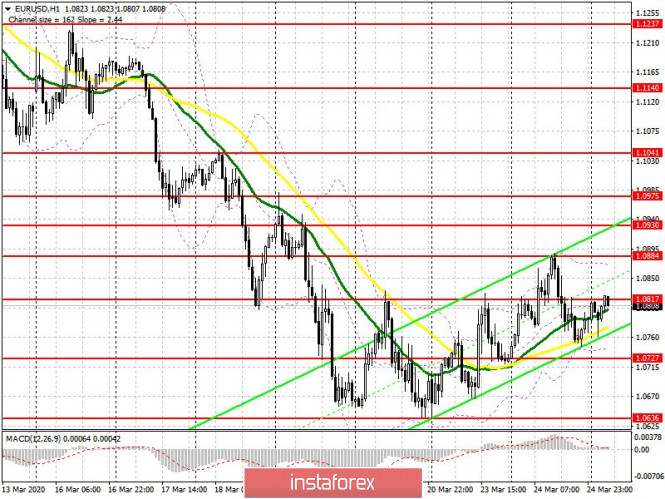
Despite the active measures taken by the Federal Reserve for an unlimited volume of bond purchases and the White House's actions, counting on approval of a $2 trillion aid package, a strong pressure did not form on the US dollar yesterday. After rising to the major resistance of 1.0884, which I have repeatedly paid attention to, the bears returned to the market, which is clearly visible on the 5-minute chart. This led to increased pressure on the euro and a decline under the resistance level of 1.0817, which is now the main headache for buyers. Only its breakout will lead to the repeated growth of EUR/USD to the highs of 1.0884 and 1.0930, where I recommend taking profits. The longer-term goal of the bulls will be the 1.0975 area. In case the euro declines further in the first half of the day, it is best to return to long positions on a false breakout from the support of 1.0727, or buy immediately on the rebound from the year's low in 1.0636, based on a rebound of 60-70 points within the day.

To open short positions on EURUSD you need:
Nothing has changed much for the sellers. They need to protect the resistance of 1.0817, where the formation of a false breakout will be an additional signal to open short positions. However, much will depend on what kind of reports on the index of business activity in Germany from the IFO Institute come out. If the data turn out to be far worse than economists' forecasts, the bears will quickly return EUR/USD to support 1.0727, consolidating below which will pull down the pair to the lows of the year 1.0636, where I recommend taking profits. More persistent sellers will wait for 1.0572 and 1.0549 to be updated. If the demand for the euro continues after the breakout of the resistance level of 1.0826, then, as yesterday, it is best to postpone sales to the test highs of 1.0884 and 1.0930, from where you can count on a rebound of 60-70 points within the day.

Signals of indicators:
Moving averages
Trading is carried out in the region of 30 and 50 moving average, which indicates the attenuation of the upward correction.
Bollinger bands
Growth will be limited by the upper level of the indicator at 1.0880. In case the euro declines further, the lower boundary of the indicator in the 1.0735 area will provide support.
Description of indicators
- Moving average (moving average determines the current trend by smoothing out volatility and noise). Period 50. The graph is marked in yellow.
- Moving average (moving average determines the current trend by smoothing out volatility and noise). Period 30. The graph is marked in green.
- MACD indicator (Moving Average Convergence / Divergence - moving average convergence / divergence) Fast EMA period 12. Slow EMA period 26. SMA period 9
- Bollinger Bands (Bollinger Bands). Period 20
