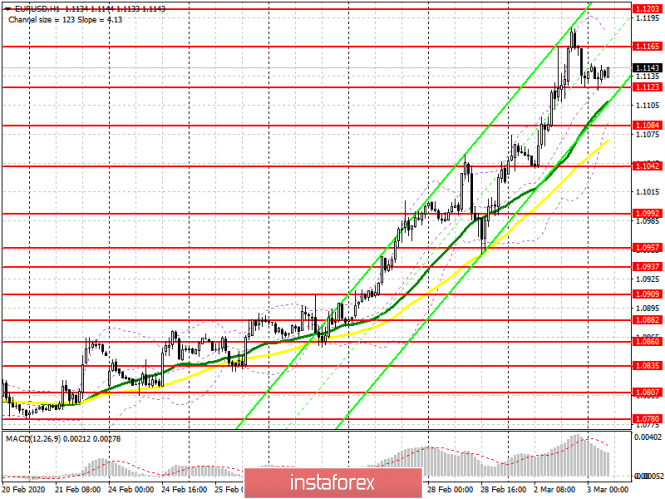
To open long positions on EURUSD you need:
The euro continued to grow yesterday and has gained more than 300 points over the past few trading days, which is a lot for this pair. Buyers took advantage of bad data on the US economy yesterday, as if they were worse than in the eurozone, and continued to push the euro up. Today, the emphasis will be shifted to the inflation report in the eurozone, which does not reach the target value of the European Central Bank. The bulls will expect to consolidate above the resistance of 1.1165, which may lead to an update of yesterday's high and a test level of 1.1203. Farther targets will be areas 1.1239 and 1.1263, where I recommend taking profits. However, it is best to return to long positions with the correction of EUR/USD to the area of 1.1123, with the formation of a false breakout there, or buy from larger lows in the areas of 1.1084 and 1.1042.
To open short positions on EURUSD you need:
The task of sellers today is to prevent the breakout of resistance at 1.1165 and the formation of a false breakout on it. However, if this does not happen, you can count on the formation of divergence on the MACD indicator after a test of high1.1203, which will be an additional signal to open short positions. Farther levels for selling are visible in the areas of 1.1239 and 1.1263, but you can count on them to rebound no more than 20-30 points inside the day. An equally important task for the bears will be the return of EUR/USD to the support level of 1.1123, which could lead to the demolition of a number of stop orders of buyers and the downward correction of the euro to the lows of 1.1084 and 1.1042, where I recommend taking profits. Weak eurozone inflation data may help sellers.
Signals of indicators:
Moving averages
Trading is conducted above 30 and 50 moving averages, which indicates the likelihood of further upward correction of the euro. With a decrease in the pair, the moving averages will also act as support.
Bollinger bands
Growth will be limited by the upper indicator level at 1.1185, while the lower boundary in the area of 1.1084 will support.

Description of indicators
- Moving average (moving average determines the current trend by smoothing out volatility and noise). Period 50. The graph is marked in yellow.
- Moving average (moving average determines the current trend by smoothing out volatility and noise). Period 30. The graph is marked in green.
- MACD indicator (Moving Average Convergence / Divergence - moving average convergence / divergence) Fast EMA period 12. Slow EMA period 26. SMA period 9
- Bollinger Bands (Bollinger Bands). Period 20
