4-hour timeframe

Amplitude of the last 5 days (high-low): 92p - 125p - 143p - 156p - 184p.
Average volatility over the past 5 days: 140p (high).
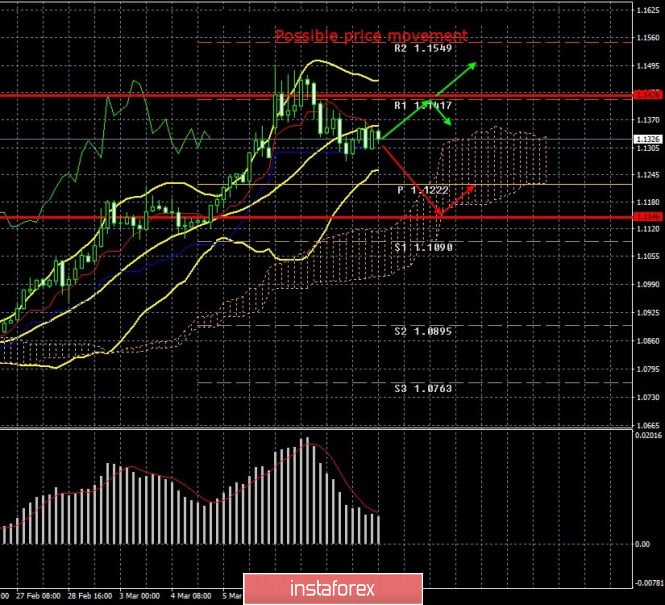
Have the markets calmed down? Today, on Wednesday, March 11, the EUR/USD pair passed "only" 80 points. Although two weeks ago this volatility value would have been considered high, in the current reality it is low. During the third trading day of the week there was no new growth or collapse of quotes of the euro/dollar pair. For most of the day, the pair traded along the critical Kijun-sen line. Thus, we believe that now there are signs that traders are starting to trade again consciously, and the state of panic is passing. Ironically, the reassurance of market participants came precisely on the day when the Bank of England urgently lowered the rate by 50 basis points, and important macroeconomic data were published in the United States and Great Britain. We will consider all British news in the next article on the GBP/USD pair, in the same we will focus on European and American news.
In fact, only one indicator was published in the United States today, but what! February consumer price index in several variations and dimensions. The main inflation rate in the United States was 2.3% y/y, which is higher than forecasted but lower than the previous month. Thus, it is definitely impossible to say whether the report turned out to be strong or weak. Moreover, the consumer price index excluding food and energy was stronger than forecast and amounted to +2.4% y/y (with market expectations +2.3%). Some experts consider this indicator to be more important and significant. Thus, both inflation rates in the US exceeded forecast values. True, these data do not yet take into account the easing of the Fed's monetary policy, as well as the panic week during which oil prices and US stock markets collapsed, and panic and chaos reigned in the foreign exchange market. There is reason to believe that the March values of all the most important indicators in the United States will give a big surprise to market participants. However, at the moment we are again stating a fact: the US macroeconomic statistics continues to remain at a very high level and shows practically no signs of slowdown. Thus, we are once again wondering if the Fed was in a hurry to lower the rate by 0.5%. And did the Fed look for a formal reason to meet Donald Trump? So far, everything looks that way.
The latest 50 basis point cut in the BoE's key rate looks like a game of catch-up. As the Fed eased monetary pressure on its economy so as not to lose on the international stage (as Trump has repeatedly said, urging Powell to lower rates as quickly and as strongly as possible), the British regulator took a similar step. Thus, the status quo between the countries has been restored. There is now only the ECB, which has not yet called emergency meetings, and has not given any comments on monetary policy. Everyone is interested in the question: what can the European regulator do in the current situation? According to many experts, when rates are already negative, each subsequent reduction will have a smaller stimulating effect on the economy. Thus, we are unlikely to get a situation with thoughtless monetary policy easing and frankly "helicopter money" in the European Union. However, it is likely that the ECB will also lower the rate, and at the same time expand the asset purchase program. Thus, all the central banks we are interested in will resort to serious stimulus measures in March. And only the Fed will have some room for maneuver in the future.
At the same time, all 27 heads of EU member states decided to invest 25 billion euros to fight the spread of the coronavirus. It is expected that 7.5 billion euros will be allocated from the Treasury of the EU, the remaining funds have yet to be raised. So far, the funds will be used to help the most affected EU countries: Italy, France and Germany. Although, according to our data, only Italy can be considered affected, and Germany and France are likely to be helped as the most developed EU countries to avoid slowing down their economies, which will lead to a slowdown in the growth of the entire bloc. There is no talk of closing the borders between the countries, but everything will depend on the further map of the spread of the COVID-2019 virus. In general, the situation is complicated.
From a technical point of view, the pair continues to adjust. As you have already understood, traders did not particularly react to today's data from overseas. Thus, the markets are calming down, but are still far from the usual trading mode. If the pair crosses the Kijun-sen line, the downward movement should continue.
A 24-hour timeframe

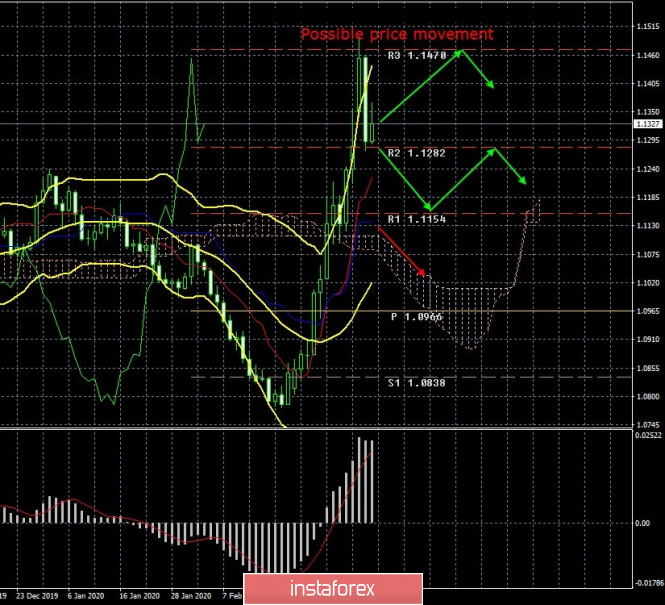
On the 24-hour timeframe, the pair made an increase to the resistance level of 1.1470, rebounded from it and also started a downward correction. At the moment, it has fallen to the level of 1.1282 and, most likely, will not stay near it. After a strong upward movement, we expect a fall to the critical Kijun-sen line at least.
Recommendations for short positions:
For selling the euro, we recommend waiting for quotes to be consolidated below the Kijun-sen line. In this case, it is recommended to sell the currency pair in small lots with the goals of the volatility level of 1.1146 and the support level of 1.1090. The daily Kijun-sen line is also located near these levels, which also serves as a target for correction.
Recommendations for long positions:
Purchases of the euro currency with the goals of 1.1417 and 1.1549 can be opened if the correction is completed and the pair returns to the area above the critical line. In any case, we recommend that you be as careful as possible when opening any positions.
Explanation of the illustration:
Ichimoku indicator:
Tenkan-sen is the red line.
Kijun-sen is the blue line.
Senkou Span A - light brown dotted line.
Senkou Span B - light purple dashed line.
Chikou Span - green line.
Bollinger Bands Indicator:
3 yellow lines.
MACD indicator:
Red line and bar graph with white bars in the indicators window.
Support / Resistance Classic Levels:
Red and gray dashed lines with price symbols.
Pivot Level:
Yellow solid line.
Volatility Support / Resistance Levels:
Gray dotted lines without price designations.
Possible price movements:
Red and green arrows.
The material has been provided by InstaForex Company - www.instaforex.com