AUD/USD
Economic data for China for February came out this morning, and the figures were much worse than forecasted. Industrial production collapsed by -13.6% y/y, fixed investment fell by 24.5% y/y, retail sales fell by 20.5% y/y, while unemployment rose from 5.2% to 6.2 % The Chinese A50 stock index is losing 1.64%. But the Australian stock market is even worse - a drop of 7.63%. Australian investors felt that the Fed's emergency measures are only evidence of a growing recession in the United States, and near-zero rates could re-develop the mortgage crisis and lead to a chain of bankruptcies.

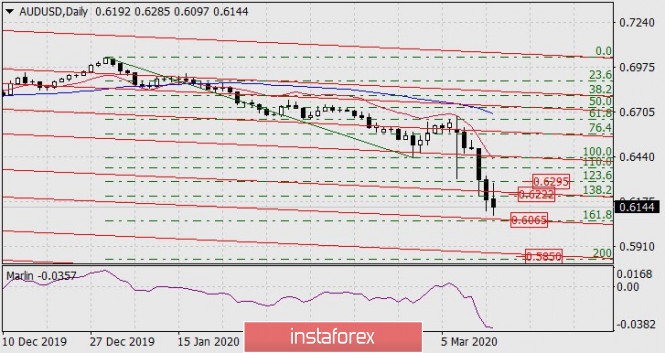
But such a strong negative reaction of the Australian market may turn out to be a temporary phenomenon that will change with the growth of the US market, if, of course, such growth occurs. On the daily chart, the price of the Australian dollar came close to the point of intersection of the embedded line of the price channel with the Fibonacci level of 161.8% at the price of 0.6065. From this point, a correctional reversal can be formed with targets 0.6222, 0.6295. Going the price below the level opens the target 0.5850, also formed by the point of intersection by the lower line of the price channel and the Fibonacci level (200.0%).

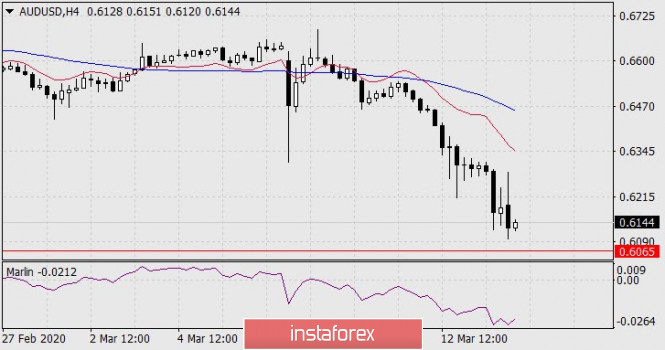
On the four-hour chart, the signal line of the Marlin oscillator shows the intention to turn out of the oversold zone, but this does not stop the price from making another low. We are waiting for the development of events.
The material has been provided by InstaForex Company - www.instaforex.com