USD/JPY
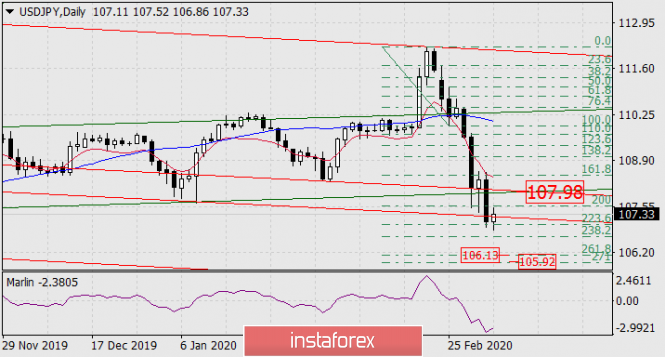
The US stock market lost 2.81% (S&P 500) on Tuesday. As a result, the yen strengthened against the dollar by 118 points on investors' desire to get out of risk, that is, according to the USD/JPY chart, there was a decrease. The price has stopped at the Fibonacci level of 223.6%, currently it is trying to overcome the red trend line of the price channel. It may be possible to do this to the price, but there is very strong resistance ahead of the two intersecting lines of the ascending and descending price channels in the region of 107.98. The price can turn down from this level again. Price taking under today's low opens the target range of 105.92-106.13, determined by Fibonacci levels of 271.0% and 261.8%.
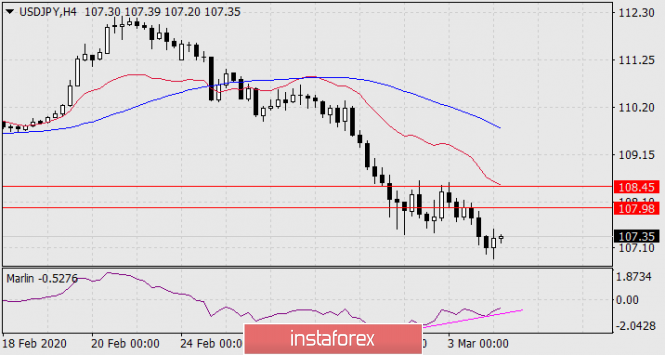
A convergence with price has formed on the four-hour chart on the Marlin oscillator. With a greater degree of probability, the price will choose a correction option. The 107.98 target level can be overcome, above it is the second target 108.45 in Fibonacci level on the daily chart 161.8%.