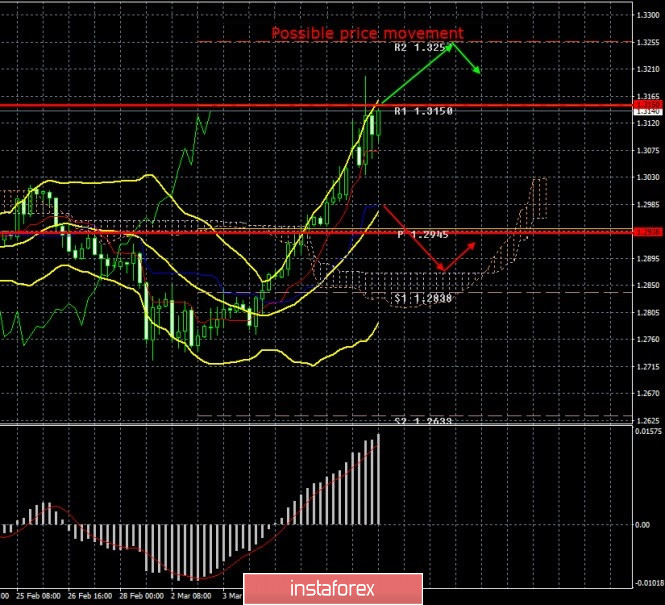
4-hour time frame

Amplitude of the last 5 days (high-low): 194p - 111p - 103p - 107p - 103p.
Average volatility over the past 5 days: 106p (high).
The British pound began the new trading week with a gap. During the day, the GBP / USD quotes still increased, so the upward movement has remained and there is still no sign of the beginning of the correctional movement. Although the pound sterling does not rise in price against the dollar for as long or as much as the Euro currency, this movement also falls under the definition of "panic". It can't be otherwise, because the fundamental reasons for the growth of the pound sterling are now the same as the Euro. Thus, in general, nothing has changed on Monday, March 9. The pair continues to grow, traders continue to panic and get rid of the American currency, and there were no macroeconomic statistics on that day.
And of course, the coronavirus is also a key topic of the day in the UK. According to the latest data from the Ministry of Health, the number of cases increased to 319, with 3 casualties. The British government, led by Boris Johnson, is already preparing a bill in case of further spread of the epidemic. However, the key issue remaining on the agenda is: what actions will the Bank of England take at the next meeting? It can be recalled that most of the world Central Banks decided to lower their key rates. Regarding the Fed, there are rumors that monetary policy may be weakened even more, and at an emergency meeting again, without waiting for the planned one. If this happens, then the US dollar will have reason for an even greater collapse and will come close to the strength of monetary policy in time for Great Britain. Thus, formally, the dollar will lose the strongest support factor in the confrontation with the British pound. Who would have thought that such a situation would become a reality in 2020? Who could have imagined that an epidemic would start that would put so much pressure on the US currency? Now, returning to the British regulator. We believe that the Bank of England cannot remain distant, especially since there were enough reasons for lowering the rate even before the appearance and spread of coronavirus. The easing of monetary policy may provide temporary support for the US currency. However, first, the meeting of the British Central Bank will not take place soon, and secondly, it may be ahead of the fed, lowering rates even more. Due to this, we believe that the pound/dollar pair remains completely uncertain. In this situation, it is best to pay special attention to technical factors that clearly indicate the direction of the current trend and the absence of a correction. However, there is a danger here. Sharp reversals are possible, strong jumps up and down are possible. In general, now is not the best time to trade.
Against the background of what is happening, negotiations between the EU and the UK regarding an agreement on Brexit faded into the background. Although, this topic remains extremely important for the future of the country and its economy. However, all other problems will be considered secondary until the problem with coronavirus is resolved.
From a technical point of view, the GBP/USD pair has completed working up the first resistance level of 1.3150 today. Thus, a rebound from this target may trigger a round of downward correction. I could have, if not for the panic in world markets and complete uncertainty. A reversal of the MACD indicator can also indicate the beginning of a corrective movement, but at the same time, this requires a parallel price drop, since the indicator can simply be discharged.
Recommendations for short positions:
In the 4-hour time frame, the pound/dollar continues to move up. Therefore, traders are suggested to stay in longs with the goal of the resistance level of 1.3257 until the MACD turns down or other signs of a correction start appear.
Recommendations for long positions:
It is recommended to sell British currency no earlier than fixing the pair below the Kijun-sen critical line. It is this moment that will allow us to conclude that the trend is changing to a downward one. However, given the range of the price from this line, it is unlikely that this will be overcome in the near future.
Explanation of the illustration:
Ichimoku indicator:
Tenkan-sen is the red line.
Kijun-sen is the blue line.
Senkou Span A - light brown dotted line.
Senkou Span B - light purple dashed line.
Chikou Span - green line.
Bollinger Bands Indicator:
3 yellow lines.
MACD indicator:
Red line and bar graph with white bars in the indicators window.
Support / Resistance Classic Levels:
Red and gray dashed lines with price symbols.
Pivot Level:
Yellow solid line.
Volatility Support / Resistance Levels:
Gray dotted lines without price designations.
Possible price movements:
Red and green arrows.
The material has been provided by InstaForex Company - www.instaforex.com