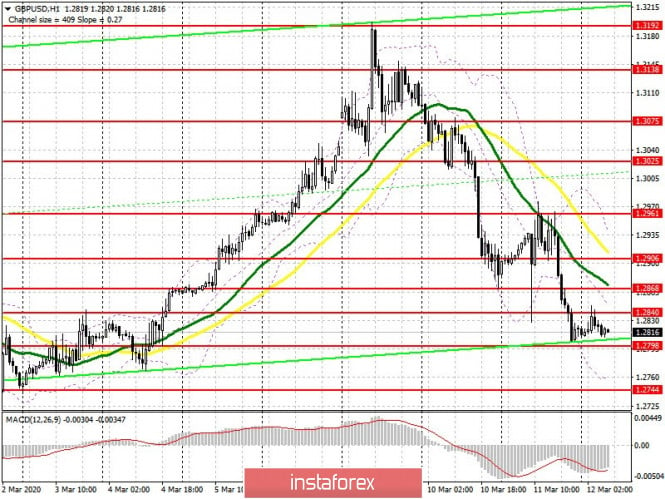
To open long positions on GBP/USD, you need:
After yesterday's interest rate cut by the Bank of England, the bulls quickly reacted and played down the entire drop. However, the inability to break above the resistance of 1.2961 quickly scared off new buyers, which led to a gradual decline in GBP/USD and a breakthrough of the rather important support of 1.2868, which I paid attention to in my forecast yesterday. At the moment, buyers only have to protect the support of 1.2798, and only the formation of a false breakout on it will be a signal to open long positions in the expectation of a return and consolidation above the resistance of 1.2840. In the scenario of a further fall in GBP/USD, which is more likely, I recommend looking at long positions from the February lows around 1.2744 and 1.2707. An equally important task for the first half of the day for the bulls will be to consolidate above the resistance of 1.2840, which will lead to an upward correction to the high of 1.2868 and 1.2906, where I recommend taking profits.
To open short positions on GBP/USD, you need:
Sellers will try to form a false breakout in the resistance area of 1.2840 in the first half of the day, which will be the first signal to open short positions. This will lead to a return of GBP/USD and a consolidation below the support of 1.2798, which will increase the pressure on the pair and allow testing the lows of February this year 1.2744. However, the longer-term goal of the bears will be to support 1.2707, where I recommend taking profits. When the pound rises above the resistance of 1.2840, it is best to return to short positions at the test of the high of 1.2906, or to rebound from the resistance of 1.2961. The only thing that can upset the sellers of the pound is the divergence that is formed on the MACD indicator. If there is no pressure on the pair below the 1.2798 support and its rapid decline, I recommend giving up short positions to break this level.
Signals of indicators:
Moving averages
Trading is conducted below 30 and 50 moving average, which indicates a continuation of the bearish trend.
Bollinger bands
In case of decline, support will be provided by the lower boundary of the indicator in the region of 1.2755. In case of an upward correction, growth will be limited near the upper boundary at 1.2945, where you can sell the pound immediately for a rebound.

Description of indicators
- Moving average (moving average determines the current trend by smoothing out volatility and noise). Period 50. The graph is marked in yellow.
- Moving average (moving average determines the current trend by smoothing out volatility and noise). Period 30. The graph is marked in green.
- MACD indicator (Moving Average Convergence / Divergence - moving average convergence / divergence) Fast EMA period 12. Slow EMA period 26. SMA period 9
- Bollinger Bands (Bollinger Bands). Period 20
