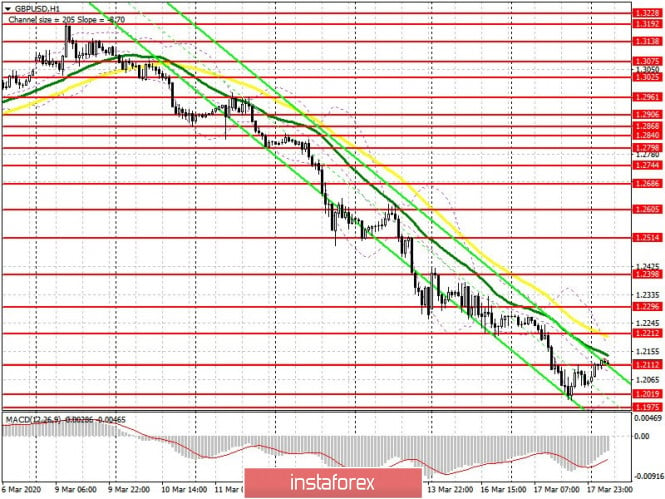
To open long positions on GBP/USD, you need:
The British pound reached the next major support levels that I noticed in yesterday's review, and rebounded from them, but the overall trend remains bearish. Yesterday's decision by the Bank of England to allocate an additional 20 billion pounds to support companies is a good sign for the economy, but not for the pound itself. At the moment, buyers are fighting for the level of 1.2112 and only consolidating it will keep the upward corrective momentum in the area of highs 1.2212 and 1.296, where I recommend taking profits. The pound also needs to cope with the average moving averages, which are slightly higher. However, a more acceptable scenario for purchases, as well as for those who believe that the bearish trend is slowing down, will be the formation of a false breakout in the support area of 1.1975, or slightly lower, in the 1.1935 area, which coincide with the low of last year. But it is best to postpone long positions until these lows are updated, since there are no serious prerequisites for a reversal of the bearish trend yet.
To open short positions on GBP/USD, you need:
Sellers are again actively fighting for the resistance of 1.2112, from which the sell-off of the British pound continued yesterday. If the bulls fail to get above this range in the first half of the day, the pressure on the pair will most likely return again, which will lead to an update of the lows of 1.2019 and 1.1975, where I recommend taking profits, since it will not be so easy to break through below these levels. A more optimal scenario for opening short positions will be the formation of a false breakout in the resistance area of 1.2212. But I recommend selling the pound immediately on a rebound only from the high of 1.2296, where it will be possible to build a new upper limit of the current downward channel. This upward correction is necessary for the pound to break through the lows of last year.
Signals of indicators:
Moving averages
Trading is conducted below 30 and 50 moving average, which indicates a continuation of the bearish trend.
Bollinger bands
In the event of a decline, support will be provided by the lower boundary of the indicator in the region of 1.2019. A break of the upper boundary of the indicator in the 1.2145 area may lead to an upward correction of the pound.

Description of indicators
- Moving average (moving average determines the current trend by smoothing out volatility and noise). Period 50. The graph is marked in yellow.
- Moving average (moving average determines the current trend by smoothing out volatility and noise). Period 30. The graph is marked in green.
- MACD indicator (Moving Average Convergence / Divergence - moving average convergence / divergence) Fast EMA period 12. Slow EMA period 26. SMA period 9
- Bollinger Bands (Bollinger Bands). Period 20
