To open long positions on GBP/USD, you need:
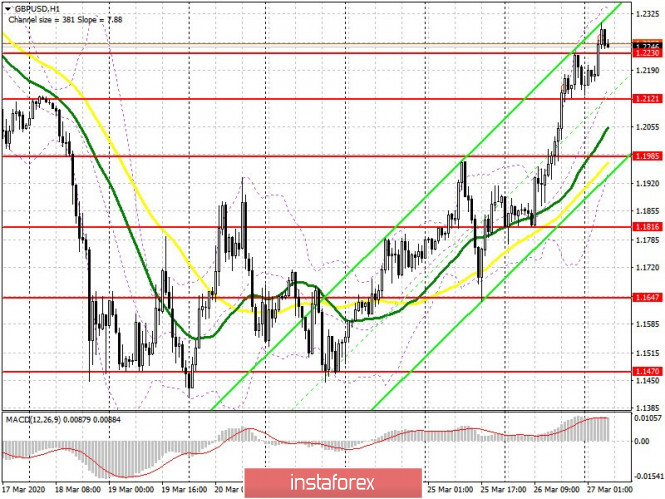
Yesterday's growth in the pound led to quite large levels of resistance, but sellers are not interested yet. But do not forget that the scale of destruction of the economy due to the coronavirus has not yet been determined and it is clearly very early to talk about the end of the pandemic. Therefore, it is not quite correct to expect further growth of GBP/USD in the medium term. Another thing is buying within the day. The formation of a false breakout in the support area of 1.2230 will be a clear signal to continue the pair's growth in order to break through and consolidate above the resistance of 1.2366, which will open a direct road to the highs of 1.2366 and 1.2514, where I recommend taking profits. If the pair returns to support 1.2230 in the first half of the day, there is no need to hurry with purchases. It is best to wait for the test of the day's low in 1.2121, or even postpone long positions until supports 1.1985 and 1.1816 are updated.
To open short positions on GBP/USD, you need:
Sellers are still watching all this. The priority task will be to return the pair to the support of 1.2230, which will raise pressure on the pound and lead to a fall to the lows of 1.2121 and 1.1985, where I recommend taking profits, since it is in this area that the lower boundary of the current ascending channel passes. In the scenario of further growth in the trend, we can talk about attempts to return to the bear market if a false breakout is formed in the resistance area of 1.2366, and it is best to open short positions immediately on a rebound from the high of 1.2514.
Signals of indicators:
Moving averages
Trade is conducted above 30 and 50 moving averages, which indicates continued growth of the pound.
Bollinger bands
A break of the upper boundary of the indicator at 1.2330 will lead to further growth of the pound. In case of a decrease in the pair, you can buy for a rebound from the lower boundary of the indicator in the 1.1985 area.

Description of indicators
- Moving average (moving average determines the current trend by smoothing out volatility and noise). Period 50. The graph is marked in yellow.
- Moving average (moving average determines the current trend by smoothing out volatility and noise). Period 30. The graph is marked in green.
- MACD indicator (Moving Average Convergence / Divergence - moving average convergence / divergence) Fast EMA period 12. Slow EMA period 26. SMA period 9
- Bollinger Bands (Bollinger Bands). Period 20
