To open long positions on GBP/USD you need:
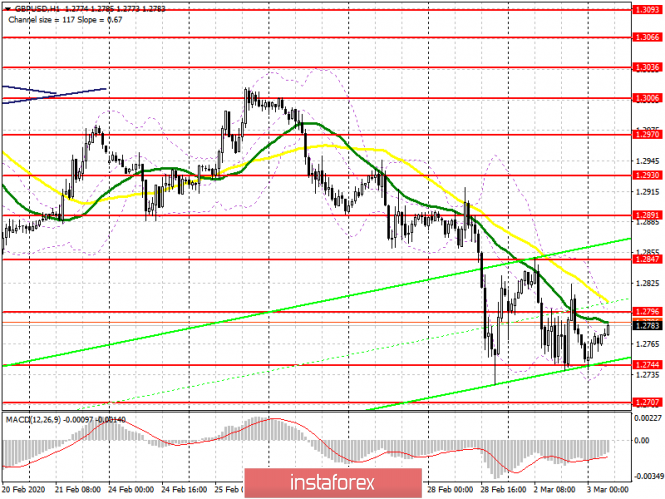
Yesterday, buyers of the pound managed to form the lower boundary of the ascending channel in the region of 1.2760, and a larger support level moved to the area of 1.2744. It is from them that the further upward correction of the pound depends. If the bulls manage to hold these areas, the return to resistance of 1.2796, where the moving averages are now located, is not ruled out, which will be a signal to open long positions in the hope of updating the high of 1.2847, which is very necessary for pound buyers to support the current bullish correction. If the level 1.2744 is broken, then it is best to return to long positions only after a test of the lows 1.2707 and 1.2664, and the lower the better. Given that all movements will be impulsive in nature, any news on trade talks will lead to a surge in market volatility.
To open short positions on GBP/USD you need:
Yesterday's data on a slowdown in the UK manufacturing index put pressure on the pound, but today there is no important fundamental news on the UK, and the bears have the right to rely on a second test and a breakout of support at 1.2744, which will return the pair to a new downward trend and lead to an update of local lows around 1.2707 and 1.2664, where I recommend taking profits. Failure to consolidate above the resistance of 1.2796 with a rebound from moving averages will also be a good signal to open short positions. It is best to sell GBP/USD immediately for a rebound from a high of 1.2847 or even higher, after updating the resistance of 1.2891, with the aim of correction of 30-40 points, after which it is better to close short positions within the day.
Signals of indicators:
Moving averages
Trading is slightly lower than 30 and 50 moving average, which saves the likelihood of continued downward correction.
Bollinger bands
A break of the upper boundary of the indicator at 1.2796 will lead to an upward correction of the pound. A break of the lower boundary at 1.2744 will raise the pressure on the pair.

Description of indicators
- Moving average (moving average determines the current trend by smoothing out volatility and noise). Period 50. The graph is marked in yellow.
- Moving average (moving average determines the current trend by smoothing out volatility and noise). Period 30. The graph is marked in green.
- MACD indicator (Moving Average Convergence / Divergence - moving average convergence / divergence) Fast EMA period 12. Slow EMA period 26. SMA period 9
- Bollinger Bands (Bollinger Bands). Period 20
