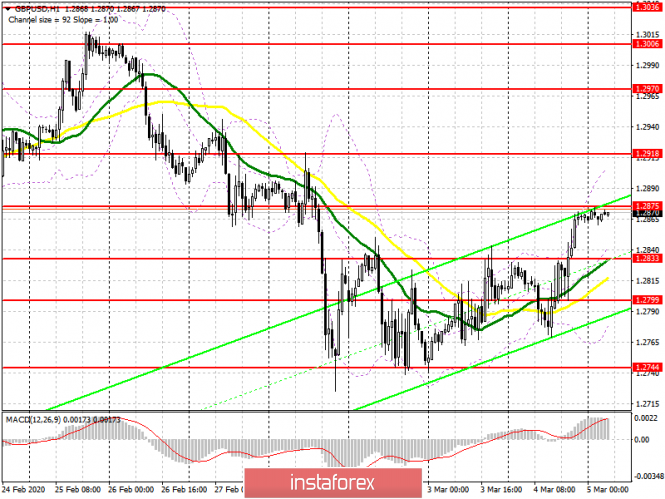
To open long positions on GBP/USD you need:
Yesterday, I repeatedly drew attention to the high probability of the British pound's continued growth, which at the moment has led to a resistance of 1.2875, on which the further upward trend depends. A break and consolidation above this range will lead to new purchases and will open a direct path for GBP/USD to the highs of 1.2918 and 1.2970, where I recommend taking profits. If the bulls do not cope with the paramount task, then when a false breakout pattern forms in the support area of 1.2833 will not be unimportant, as this will act as an additional signal for opening long positions. In the absence of activity at this level, and it is quite possible market participants will wait for the performance of the head of the Bank of England Mark Carney, it is best to postpone purchases until the test of the lows 1.2799 and 1.2765, on which the further bullish trend depends.
To open short positions on GBP/USD you need:
Pound sellers are still holding a wait-and-see position, however, in the morning, attention will be at a new resistance level of 1.2875, where the formation of a false breakout will be a kind of signal to open short positions. In this scenario, we can expect the GBP/USD to return to the support area of 1.2833, and then the test of a larger low of 1.2799, where I recommend taking profits. With the option of continued growth of the pair, amid the absence of important fundamental statistics, you can look at short positions after updating the high of 1.2918, or sell GBP/USD immediately for a rebound in the region of 1.2973.
Signals of indicators:
Moving averages
Trading is conducted above 30 and 50 moving average, which indicates that the upward correction will likely continue.
Bollinger bands
Growth will be limited by the upper level of the indicator at 1.2900. In case the pound falls, the middle of the 1.2840 channel will provide support.

Description of indicators
- Moving average (moving average determines the current trend by smoothing out volatility and noise). Period 50. The graph is marked in yellow.
- Moving average (moving average determines the current trend by smoothing out volatility and noise). Period 30. The graph is marked in green.
- MACD indicator (Moving Average Convergence / Divergence - Moving Average Convergence / Divergence) Fast EMA period 12. Slow EMA period 26. SMA period 9
- Bollinger Bands (Bollinger Bands). Period 20
