Despite all the disadvantages, financial markets have one very good feature - nothing can fall forever, and sooner or later the reverse upward movement begins. This feature is most clearly expressed in the currency market. This is what we see when we look at the single European currency. A completely empty macroeconomic calendar, as well as the equally appalling situation with coronavirus in Europe and the United States, probably became the key to the growth of the single European currency. The scale of the collapse was so significant that the euro, simply by the laws of the market, had to start growing sooner or later. But the question is, is this a reversal, or is it just a temporary rebound?

The situation in the debt market suggests that this is a rebound, and not some kind of reversal and change of trend. After all, the yield on European debt securities continues to grow. Consequently, capital flight continues. For example, in France, the yield on 3-month bills rose from -0.608% to -0.528%. The yield on 6-month bonds rose from -0.615% to -0.535%. Well, the yield of 12-month bills increased from -0.625% to -0.534%. Such an increase in yields, in the context of expanding stimulus measures of the European Central Bank, can only be due to the fact that large investors are getting rid of European debt securities. The only question is, where do these same investors then go with the released funds? After all, money can not just lie idle.

It is not strange, but the funds flow to the United States. And not in the stock market, but in debt. After all, the yield of 3-month bills fell from 0.290% to 0.000%. Well, the yield of 6-month bills fell from 0.300% to 0.080%. This is amid the incredibly rapid reduction in the Federal Reserve's refinancing rate. This is possible only if investors really sell everything and everything, and transfer funds to the United States. So it is not surprising that the dollar is rapidly becoming more expensive. And as you can see from the dynamics of government debt yields, the process is far from complete.

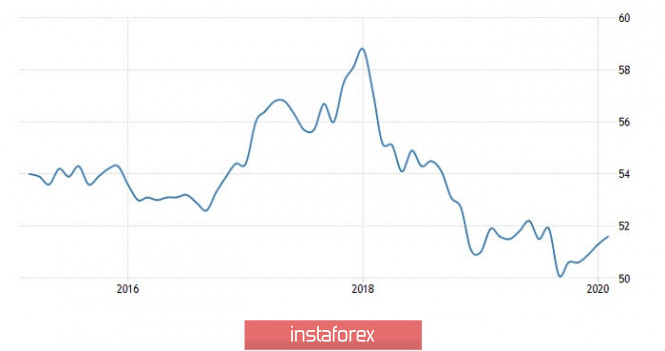
Today, market participants will be able to rely on at least some macroeconomic data. And even though this is just preliminary data on indexes of business activity. The fact is that this is the first data for March. The same March when Europe and the United States encountered the coronavirus. It is clear that the economic damage will be incredibly large-scale. But how exactly? But most importantly, who will suffer the most? Europe or North America? So, the forecasts for Europe are extremely disappointing. In particular, the index of business activity in the service sector should collapse from 52.6 to 37.5. The manufacturing index may fall from 49.2 to 39.6. As a result, the composite PMI is likely to fall from 51.6 to 38.5. In other words, all indexes, with the exception of production, should set new record lows.
The composite index of business activity (Europe):

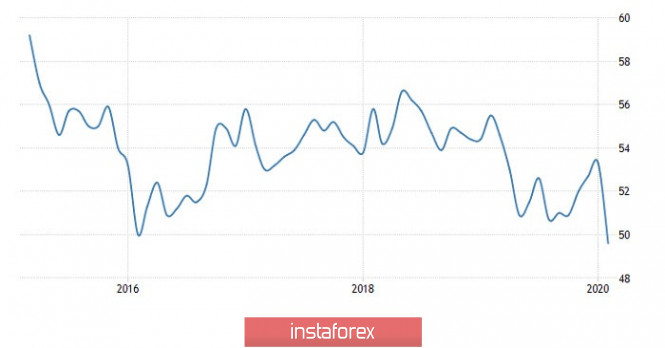
But even in the United States, they expect a banal collapse of all business activity indices. Thus, the index of business activity in the service sector may decrease from 49.4 to 40.0. The manufacturing sector is expected to reduce from 50.7 to 42.0. As a result, the composite PMI should fall from 49.6 to 40.8. So the picture is very, very sad. Another thing is that the expected scale of decline is still not the same as in Europe. Consequently, the situation in the United States is not much better, which means that the dollar continues to be more attractive.
The composite index of business activity (United States):

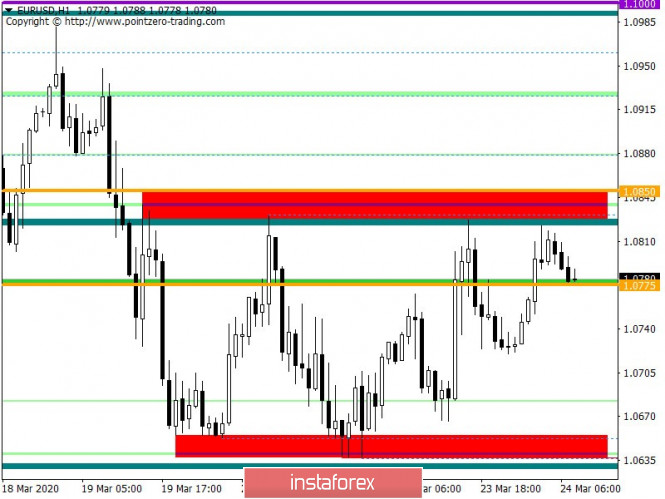
From the point of view of technical analysis, we see a local upward movement towards the highs of March 20 and 23, where the resistance point in the face of a variable level of 1.0830 was previously found. In fact, the quote continues to move in the conditional side channel having a wide range of fluctuations of 1.0650/1.0830 (1.0850).
In terms of a general review of the trading chart, we see a downward trend, where the last two weeks there was a solid inertial move.
It can be assumed that the movement within the established framework of 1.0650/1.0830 will continue in the market where the development of the 1.0830 boundary in the downward direction is initially considered.
Concretizing all of the above into trading signals:
- We will consider long positions after the descent to the area of 1.0650/1.0700.
- We consider short positions lower than 1.0765, towards 1.0700 -> 1.0650.
From the point of view of a comprehensive indicator analysis, we see that due to the price movement within a wide range, the indicators of technical tools on the minute and hour periods work relative to it. Daily periods invariably keep a sell signal, amid a general decline.

