4-hour timeframe

Technical details:
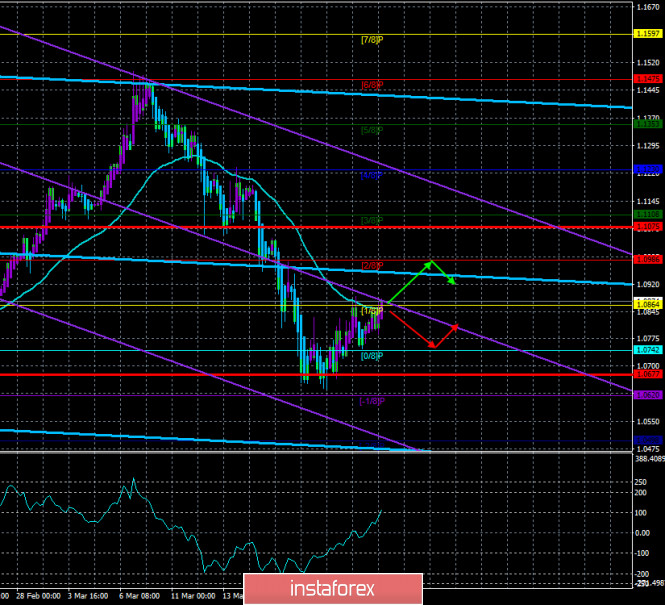
Higher linear regression channel: direction - downward.
Lower linear regression channel: direction - downward.
Moving average (20; smoothed) - downward.
CCI: 116.0337
The third trading day of the week passed for the EUR/USD currency pair in vain attempts to gain a foothold above the moving average line. According to the Ichimoku indicator, if the pair barely overcame the critical Kijun-sen line, then it will most likely perform a rebound from the moving average and will have a good chance of resuming the downward movement. As we have already said, the volatility of the euro/dollar pair has subsided a little, and this is an encouraging moment. If everything continues in the same direction, the pair will return at least to the values of 60-100 points per day. It is much more pleasant to trade a pair knowing that it will not break at any time by three hundred points in any direction.
On Wednesday, March 25, several macroeconomic reports were published that deserve attention. There was not a single significant publication in the European Union on this day. Only in Germany, several indices from the IFO were published. It is easy to guess that most of them were worse than the forecast values. For example, the index of economic expectations in March fell from 82.0 to 79.7, the index of business optimism – from 87.7 to 86.1, and the indicator for assessing the current situation – from 93.8 to 93.0. Losses are minimal, but the indices themselves from the research group CESifo are frankly secondary and did not cause any reaction even when there was no panic in the markets. Now, it was naive to expect that traders would rush to work out data on the expectations of 7,000 German business leaders.
Much more interesting data were published overseas. The main indicator of orders for durable goods in the US in February was 1.2% m/m with forecasts of -0.8% m/m. The indicator of orders for goods excluding defense showed an increase of 0.1% with weaker forecasts (-0.9% m/m). The indicator excluding transport orders was -0.6% m/m (forecasts were slightly better), while the indicator excluding defense and aviation orders was -0.8 m / m(forecasts were also slightly better). Thus, two of the four indicators exceeded forecasts, and two were worse. Based on this, we believe that the package of macroeconomic statistics from overseas is neither positive nor negative and, accordingly, could not cause a significant strengthening of the US currency in the afternoon of Wednesday. It should also be noted that all published indicators were related to the month of February, so they had a low value for market participants who are waiting for indicators for March when the epidemic gained momentum both in the United States and in the European Union.
Thanks to the coronavirus epidemic – bars, restaurants, cafes, sports facilities, schools, universities, and so on have been closed in the United States, as in many other countries that have declared quarantines. Thus, unemployment has soared, leaving millions of workers temporarily without wages and out of work. Given how much damage the epidemic has already caused to both the world economy and the American economy, it is naive to assume that when the virus is defeated, workers will simply return to their jobs and everything will heal as before. Most likely, the US, like other countries, will face a series of bankruptcies, no matter how the central bank and government stimulate the economy. So, in any case, the American economy has already sunk and will continue to do so. As early as today, the Senate could vote "Yes" to provide an additional $2 trillion in aid to households, small businesses, and companies on the verge of bankruptcy. The current national debt of the country is 23.5 trillion dollars. It is easy to calculate that after the next injection into the economy, the debt will be equal to 25.5 trillion dollars. It is reported that when Trump took office as President of the United States, the national debt was about 20 trillion and Trump promised to completely eliminate it by 2025. However, the projected economic growth of 6% was not achieved. Moreover, in the last year and a half, GDP growth has been declining from a maximum of 3%, "thanks" to the trade wars that Trump himself unleashed. Given the fact that the longer the country is in a state of quarantine, the more the economy shrinks. It is understandable why Trump insists on canceling all quarantine measures. According to the US President, the epidemic can be survived, but it is impossible to allow the economy to fall. "You can't just come in and say: let's shut down the US, the most successful country in the world. We need to get back to work," the American President believes. Also, Trump notes that thousands of people die every year because of the flu, but no one has ever thought of introducing a quarantine because of it. "A huge number of people are killed in car crashes, but we are not asking automakers to stop making cars," Trump said. According to the US leader, there will be much greater losses if the country enters a state of recession or depression. "A country can be destroyed by acting in this way, forcing its citizens to stop working. We had the best economic growth figures in the country's history three weeks ago," Donald Trump said.

In the United States, the number of people infected with "coronavirus", meanwhile, has grown to 55,500. And, as with the UK, the real number of people infected may be much higher.
From a technical point of view, the EUR/USD pair is currently trading near the moving average. Thus, another attempt can be made to overcome the moving average line, as well as the Murray level of "1/8"-1.0864. Both linear regression channels are directed downward, indicating a downward trend in the medium and long term. If traders do not manage to overcome the moving average, the chances of resuming the downward trend will increase several times.

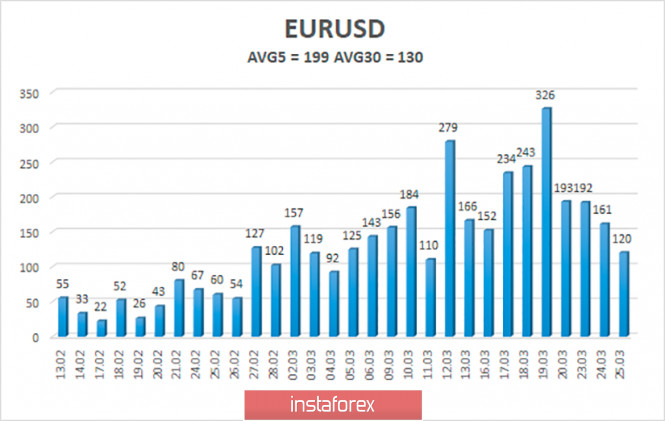
The average volatility of the euro/dollar currency pair remains at record high values but still begins to gradually decrease. At the moment, the average value for the last 5 days is 199 points and the last four days have shown volatility significantly below 200 points per day. On Thursday, March 26, we expect a further decrease in volatility and movement within the channel, limited by the levels of 1.0677 and 1.1075.
Nearest support levels:
S1 - 1.0742
S2 - 1.0620
S3 - 1.0498
Nearest resistance levels:
R1 - 1.0864
R2 - 1.0986
R3 - 1.1108
Trading recommendations:
The euro/dollar pair continues its upward correction. Thus, traders are still recommended to consider selling the euro currency with targets of 1.0742 and 1.0677 in the event of a price rebound from the moving average line. It is recommended to buy the EUR/USD pair not before fixing the price above the moving average with the first target of the Murray level of "2/8"-1.0986. When opening any positions, we recommend increased caution, since the market is still in a state of panic.
Explanation of the illustrations:
The highest linear regression channel is the blue unidirectional lines.
The lowest linear regression channel is the purple unidirectional lines.
CCI - blue line in the indicator window.
Moving average (20; smoothed) - blue line on the price chart.
Murray levels - multi-colored horizontal stripes.
Heiken Ashi is an indicator that colors bars in blue or purple.
Possible variants of the price movement:
Red and green arrows.
The material has been provided by InstaForex Company - www.instaforex.com