4-hour timeframe

Technical details:
Higher linear regression channel: direction - downward.
Lower linear regression channel: direction - downward.
Moving average (20; smoothed) - down.
CCI: -129.2733
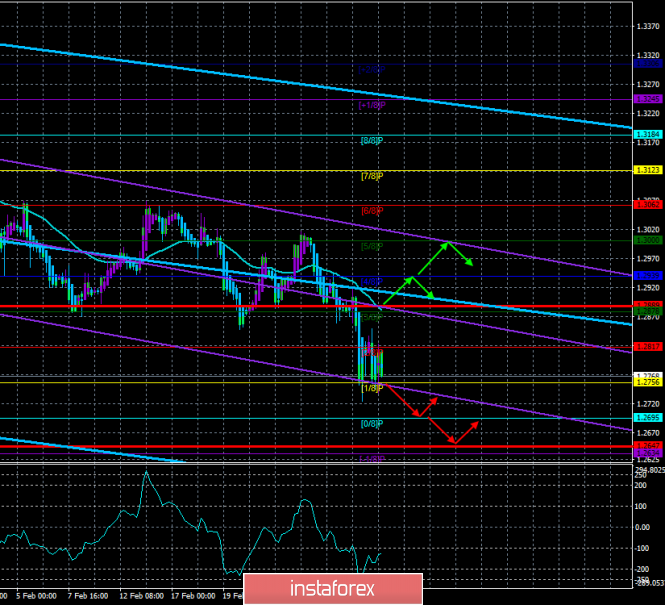
The British pound ended the first trading day of the week with completely opposite movements between the Murray levels of "1/8" and "2/8", which is clearly visible from the illustration above. Thus, the correction has really begun, although it does not look quite clear. The Heiken Ashi indicator alternates between purple and blue bars and each of them is quite impressive in size. However, now the Murray level of "1/8" can be considered a local minimum that bears need to overcome in order to continue the downward movement. On Monday, March 2, only one report was published in the UK and two in the United States. On Tuesday, March 3, no reports will be published either in the United States or in the UK. Thus, the macroeconomic background will be completely empty for the pound/dollar pair. Of course, there is some hope for the fundamental background - namely the speech of Fed member Loretta Meister, the unexpected speech of Boris Johnson, Jerome Powell, Mark Carney, Michel Barnier or David Frost. After all, negotiations on a deal with the European Union have officially begun, the world is raging epidemic of "coronavirus", and the world's largest central banks are preparing to reduce rates. Thus, comments from top officials may well come in an unplanned way. If nothing interesting is presented to us today and the fundamental background, then volatility may remain low, and the downward movement is unlikely to resume.
Meanwhile, some information from the negotiations has already started to arrive. However, now it is frankly secondary in nature. David McCallister, President of the European Parliament's Foreign Affairs Committee, said yesterday: "Negotiations with London have begun today and we are entering a critical phase that will set the tone for the future relationship between the EU and the UK. Mutual trust and respect must prevail in negotiations so that the parties can reach the best solution. Michel Barnier and his team can count on the full support of the European Parliament." Mr. McCallister also recalled that the European Parliament adopted a resolution according to which the negotiating group should do everything possible to protect the interests of European citizens and European businesses.
From a technical point of view, a correction is now taking place. Volatility on Monday returned to the usual value of about 100 points per day. The downward trend continues (both channels of linear regression are directed downward). However, to continue the downward movement, you need to confidently overcome the level of 1.2756. On Wednesday, a number of important economic data will be published, so it is possible that this overcoming will happen the day after tomorrow.

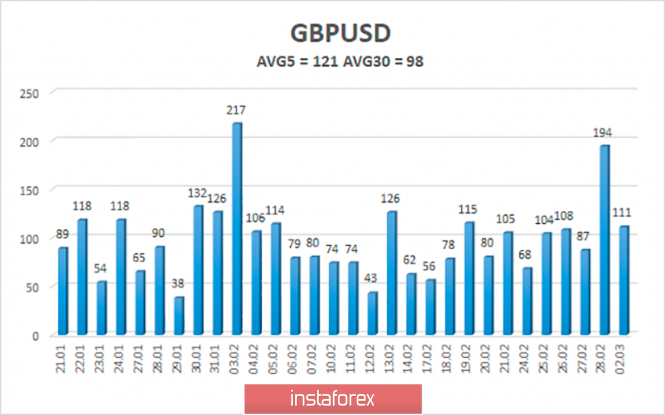
The average volatility of the pound/dollar pair over the past 5 days is 121 points. However, if we consider the last abnormal Friday, this figure does not exceed 90 points. Thus, Friday's 200 points can not be considered a pattern. Thus, on Tuesday, we expect the pair to move within the volatility channel of 1.2647-1.2889.
Nearest support levels:
S1 - 1.2756
S2 - 1.2695
S3 - 1.2634
Nearest resistance levels:
R1 - 1.2817
R2 - 1.2878
R3 - 1.2939
Trading recommendations:
The GBP/USD pair started a correction after an unsuccessful attempt to overcome the level of 1.2756. Thus, it is still recommended to sell the pound with the targets of 1.2695 and 1.2647 if this level is overcome or the Heiken ASHI indicator turns down. You can buy the British currency with the targets of 1.2939 and 1.3000, but in small lots, if traders fix the pair above the moving average line.
In addition to the technical picture, you should also take into account the fundamental data and the time of their release.
Explanation of the illustrations:
The highest linear regression channel is the blue unidirectional lines.
The lowest linear regression channel is the purple unidirectional lines.
CCI - blue line in the indicator window.
Moving average (20; smoothed) - blue line on the price chart.
Murray levels - multi-colored horizontal stripes.
Heiken Ashi is an indicator that colors bars in blue or purple.
Possible variants of the price movement:
Red and green arrows.
The material has been provided by InstaForex Company - www.instaforex.com