
Trend analysis:
This week, the price, having broken away from the support line 1.0673 (red bold line), will move up with the target at 1.0763 - a pullback level of 14.6% (red dashed line). Upon reaching which, it is possible to continue working upwards with the target of 1.0839 - a pullback level of 23.6% (red dashed line).
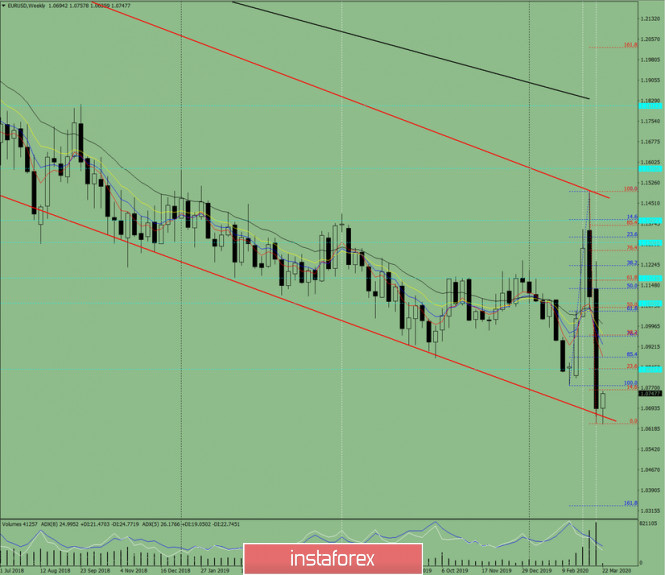
Fig. 1 (weekly schedule).
Comprehensive analysis:
- indicator analysis - up;
- Fibonacci levels - up;
- volumes - up;
- candlestick analysis - neutral;
- trend analysis - up;
- Bollinger Lines - up;
- monthly chart - up.
The conclusion of a comprehensive analysis is an upward movement.
The overall result of calculating the candle of the EUR / USD currency pair according to the weekly chart: the price of the week is likely to have an upward trend with the absence of the first lower shadow of the weekly white candlestick (Monday - up) and the presence of the second upper shadow (Friday - down).
The unlikely lower scenario: there will be a movement down with the lower target of 1.0334 - the target level of 161.8% (blue dashed line) from the level of 1.0693 (closing of the previous weekly candle).
The material has been provided by InstaForex Company - www.instaforex.com