To open long positions on EURUSD, you need:
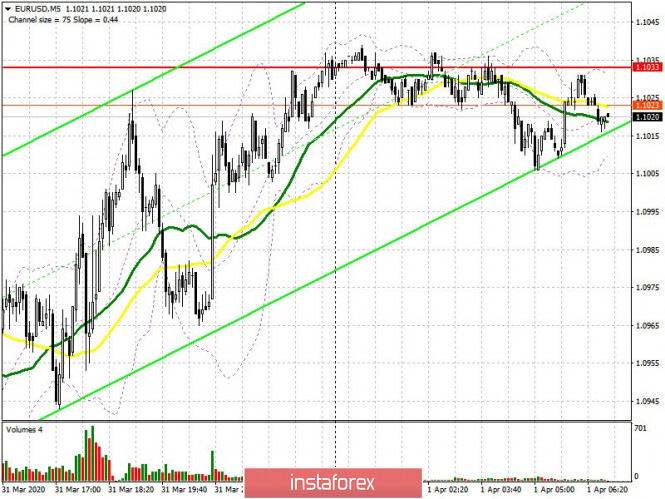
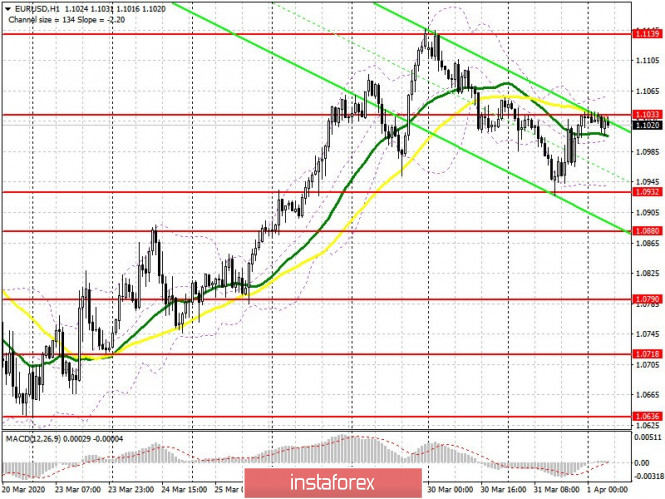
Yesterday, the bulls managed to return to the market from the support of 1.0932, which I drew attention to in my review for the second half of the day. The rebound from this level is clearly visible on the 5-minute chart, as well as the purchases that could be observed after each attempt of the bears to return to this range. At the moment, attention will be focused on the data on the index of manufacturing activity and the labor market in the eurozone, although they are unlikely to have a strong impact on the euro, which can not be said about the reports on the US economy, set to be released in the afternoon. Bulls need to return the resistance of 1.1033, above which the upper boundary of the current descending channel passes. Consolidating on this range will allow you to count on the repeated growth of EUR/USD to the weekly high of 1.139 and its update in 1.1231, where I recommend taking profits. If pressure on the pair persists further, it is best to return to long positions after the support test of 1.0932, provided that a false breakout is formed there, or immediately to rebound from a low of 1.0880.

To open short positions on EURUSD you need:
Sellers will actively defend the resistance of 1.1033, on which a lot depends in the short term. The formation of a false breakout in the first half of the day at this level will signal the opening of new short positions based on weak data on the eurozone labor market and low production activity, which will lead EUR/USD to yesterday's low in the 1.0932 area. However, the longer-term goal of sellers is to support 1.0880, where I recommend taking profits. If the bulls manage to regain the resistance of 1.1033 in the first half of the day, it is best to return to short positions only for a rebound from the weekly high of 1.139, or from the larger area of 1.1231.

Signals of indicators:
Moving averages
Trade is carried out in the region of 30 and 50 moving average, which indicates the formation of a side channel in the short term.
Note: The period and prices of moving averages are considered by the author on the hourly chart H1 and differs from the general definition of the classic daily moving averages on the daily chart D1.
Bollinger bands
Growth will be limited by the upper boundary of the indicator in the area of 1.1065. A break of the lower boundary of the indicator in the region of 1.1000 will increase pressure on the euro.
Description of indicators
- Moving average (moving average determines the current trend by smoothing out volatility and noise). Period 50. The graph is marked in yellow.
- Moving average (moving average determines the current trend by smoothing out volatility and noise). Period 30. The graph is marked in green.
- MACD indicator (Moving Average Convergence / Divergence - moving average convergence / divergence) Fast EMA period 12. Slow EMA period 26. SMA period 9
- Bollinger Bands (Bollinger Bands). Period 20
