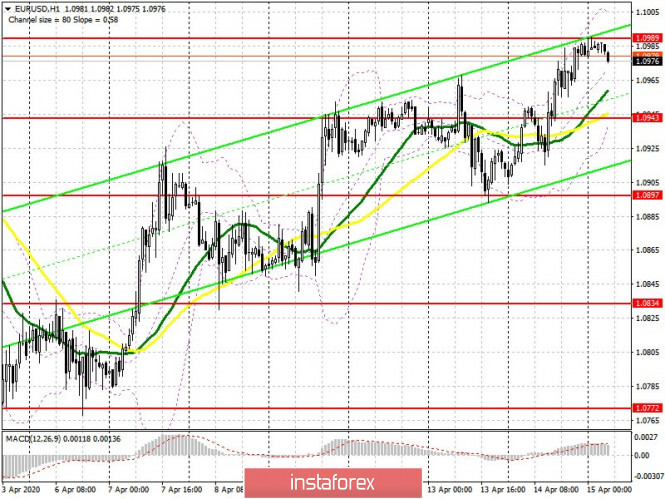
To open long positions on EURUSD, you need:
Bulls continue to remain optimistic and aim to break the resistance of 1.0989, which formed today in the Asian session. The lack of important fundamental statistics keeps the demand for the euro, but given that today we are waiting for eurozone inflation data, there could be problems with growth above 1.0989. A break and consolidation at this level will open a direct road to the area of new highs 1.1040 and 1.1093, where I recommend taking profits. If the pressure on the euro returns after the reports, it is likely that the bulls will be able to show themselves only when a false breakout forms in the support area of 1.0943, just above which the moving averages pass. I advise opening long positions in EUR/USD immediately for a rebound only after updating the low of 1.0897.
To open short positions on EURUSD, you need:
The primary task of sellers of the euro is to form a false breakout in the resistance area of 1.0989, which will be a signal to open short positions in the expectation of a decline to the support of 1.0943. Weak reports on inflation in Italy and France could force traders to take profits on long positions, which will lead to a break in the support of 1.0943 and a larger movement of the pair down to the low of 1.0897. However, if the bulls still manage to pick up the resistance of 1.0989 in the first half of the day, then I recommend selling EUR/USD immediately for a rebound only after testing the high of 1.1040, since data US retail sales data, which is set for release in the second half of the day, can return demand for the greenback.

Signals of indicators:
Moving averages
Trade is conducted slightly above 30 and 50 moving average, which indicates the preservation of the advantage of buyers of the European currency.
Note: The period and prices of moving averages are considered by the author on the hourly chart H1 and differs from the general definition of the classic daily moving averages on the daily chart D1.
Bollinger bands
Growth will be limited by the upper level of the indicator at 1.0995. A break of the lower border at 1.0955 will raise the pressure on the euro.
Description of indicators
- Moving average (moving average determines the current trend by smoothing out volatility and noise). Period 50. The graph is marked in yellow.
- Moving average (moving average determines the current trend by smoothing out volatility and noise). Period 30. The graph is marked in green.
- MACD indicator (Moving Average Convergence / Divergence - moving average convergence / divergence) Fast EMA period 12. Slow EMA period 26. SMA period 9
- Bollinger Bands (Bollinger Bands). Period 20
