To open long positions on EURUSD, you need:
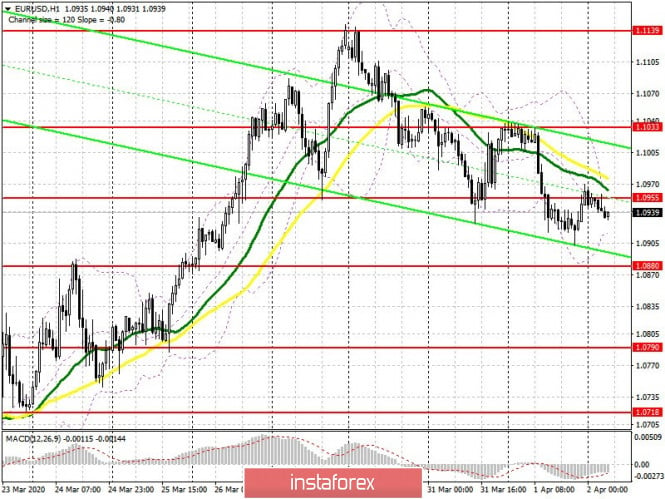
Yesterday, bulls managed to prevent the euro from sharply falling below 1.1139, however, the bears formed a new resistance at 1.0955 today, at the Asian session. Good reports on the state of the US manufacturing sector amid the COVID-19 pandemic crisis maintained demand for the US dollar yesterday afternoon. Buyers of the euro currently need to break through and consolidate above the resistance of 1.0955, just above which the moving averages pass. If they manage to do this after the release of data on eurozone producer prices, which may fall much more than expected, the demand for EUR/USD will grow, which will lead to an update of the upper boundary of the descending channel, as well as a resistance test of 1.1033, where I recommend taking profits. However, a more rational option would be to buy on the euro's fall in the area of a large support of 1.0880, provided that a false breakout is formed there. Given that the slowdown in producer prices will be another bad signal for the European Central Bank, it is best to open long positions to rebound from the low of 1.0790.

To open short positions on EURUSD you need:
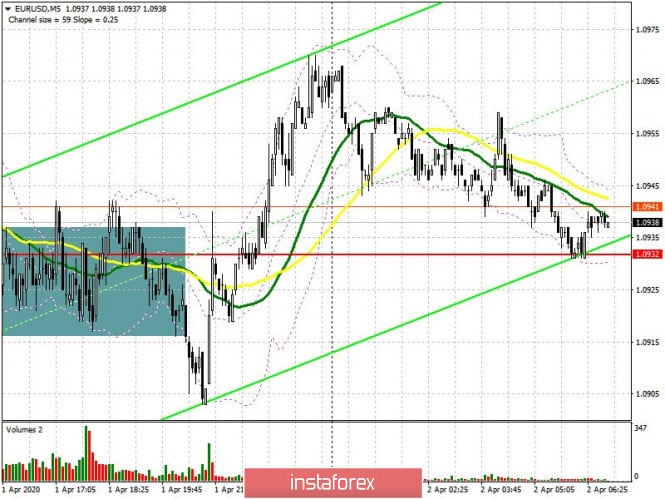
Bears tried to break below the resistance of 1.0932 yesterday, which is clearly visible on the 5-minute chart, but this did not lead to a more powerful sell-off of the euro. Today, sellers will actively defend the resistance of 1.0955, which was formed in the Asian session after the euro's slight upward correction until the US session ended on Wednesday. The formation of a false breakout there will be another signal to sell EUR/USD in the hope of further pulling down the pair to the lower boundary of the descending channel and updating the weekly lows with a support test of 1.0880, where I recommend taking profits. Sellers should not be upset in case the pair grows above the resistance of 1.0955. You can safely watch short positions from the upper boundary of the descending channel, or sell for a rebound slightly higher, from the resistance of 1.1033.

Signals of indicators:
Moving averages
Trade is conducted below 30 and 50 moving averages, which indicates a further decline in the euro in the short term.
Note: The period and prices of moving averages are considered by the author on the hourly chart H1 and differs from the general definition of the classic daily moving averages on the daily chart D1.
Bollinger bands
A break of the lower boundary of the indicator will lead the euro to a low of 1.0880. Growth above the upper boundary of the indicator will hit stop orders and lead to a more powerful upward correction.
Description of indicators
- Moving average (moving average determines the current trend by smoothing out volatility and noise). Period 50. The graph is marked in yellow.
- Moving average (moving average determines the current trend by smoothing out volatility and noise). Period 30. The graph is marked in green.
- MACD indicator (Moving Average Convergence / Divergence - moving average convergence / divergence) Fast EMA period 12. Slow EMA period 26. SMA period 9
- Bollinger Bands (Bollinger Bands). Period 20
