To open long positions on EURUSD you need:
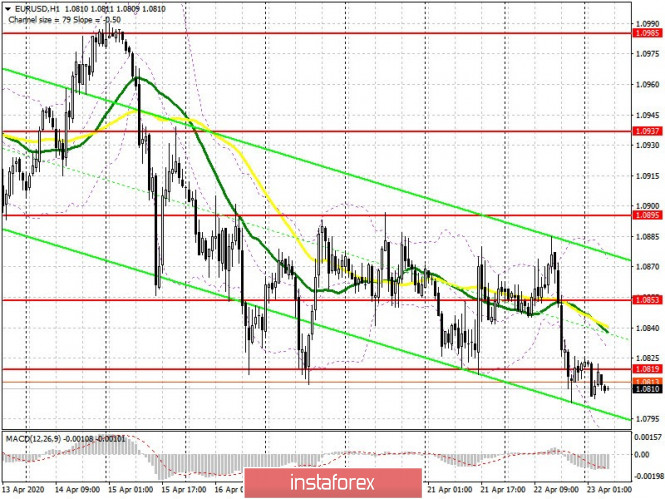
The euro's decline from yesterday afternoon after an unsuccessful attempt to reach the upper border of the side channel 1.0895 made it possible for us to test a large support level of 1.0814. However, as we can see on the chart, there still isn't anyone who would want to sell the euro in the region of the lower border of the side channel, and most likely the data on activity in the manufacturing and services sectors of the eurozone countries will determine the direction, as well as decisions taken at the EU summit which will be held today in the form of an online conference. The bulls need an operational return to resistance 1.0819 in the first half of the day, since consolidating above this level will allow us to expect a return to the middle of the side channel 1.0853, and then to update its upper border in the region of 1.0895, where I recommend taking profit. If the pressure on EUR/USD persists, then most likely the bulls will retreat to a large support level of 1.0770, and I advise you to open long positions immediately for a rebound only at a low of 1.0718.
To open short positions on EURUSD you need:
Sellers took advantage of poor data on consumer confidence in the eurozone and pushed the euro to support 1.0814, which was their target for the middle of the week. At the moment, forming a false breakout in the resistance area of 1.0819, along with poor reports on the state of the manufacturing and service sectors in Germany, France and the eurozone, will be a signal to open short positions while expecting a bearish trend that can return the pair to a low of 1.0770 . Sellers will be aiming for a low of 1.0718 until the end of the week, where I recommend taking profits. In the EUR/USD growth scenario in the morning, it is best to look at short positions on the test of the middle of the side channel 1.0853, where the moving averages also goes. You can sell the pair immediately for a rebound from the upper border in the area of 1.0895.

Signals of indicators:
Moving averages
Trade is conducted below 30 and 50 moving averages, which indicates the bearish nature of the market, while maintaining a chance for the euro to decline further.
Note: The period and prices of moving averages are considered by the author on the hourly chart H1 and differs from the general definition of the classic daily moving averages on the daily chart D1.
Bollinger bands
Growth may be limited by the upper level of the indicator at 1.0870. A break of the lower border of the indicator at 1.0780 will only raise the pressure on the euro.
Description of indicators
- Moving average (moving average determines the current trend by smoothing out volatility and noise). Period 50. The graph is marked in yellow.
- Moving average (moving average determines the current trend by smoothing out volatility and noise). Period 30. The graph is marked in green.
- MACD indicator (Moving Average Convergence / Divergence - moving average convergence / divergence) Fast EMA period 12. Slow EMA period 26. SMA period 9
- Bollinger Bands (Bollinger Bands). Period 20
