To open long positions on EURUSD, you need:
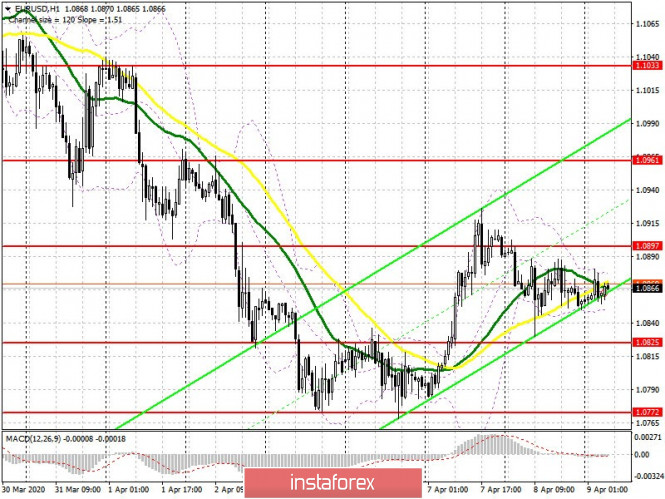
The EUR/USD pair's situation did not change in any way yesterday afternoon, since the minutes of the Federal Reserve were of a passing nature and traders did not find anything new in them. The absence of important fundamental statistics in the morning, except for the European Central Bank's minutes, which is unlikely to affect the market, will likely keep the pair in the side channel. However, market participants will wait for the results of the Eurogroup's next meeting on the issue of providing assistance worth 500 billion euros. Nothing has changed from a technical point of view. Bulls still need to return to the resistance of 1.0897, which will make it possible for the pair to maintain an upward trend and also lead to a repeated update of the high of 1.0961, where I recommend taking profits. In case the euro falls to the support area of 1.0825, long positions can be returned only if a false breakout forms there. Buy EUR/USD immediately on the rebound, I recommend only from this week's low in the area of 1.0772, based on 40-50 points of correction within the day.
To open short positions on EURUSD you need:
Bears also took a wait-and-see attitude and will most likely only show themselves if the talks between the eurozone finance ministers fail again. It is best to return to short positions in the first half of the day only when a false breakout forms at the level of 1.0897, which will increase pressure on the euro and lead to a repeated decline to the low of 1.0825. However, only a break in this range will allow sellers to build a new downward trend that can return EUR/USD to the weekly low of 1.0772, where I recommend taking profits. In case EUR/USD grows above the resistance of 1.0897, it is best to postpone selling immediately for a rebound until the high of 1.0961 is updated, counting on a correction of 30-40 points within the day.

Signals of indicators:
Moving averages
Trading is carried out in the region of 30 and 50 moving average, which indicates further uncertainty with the direction of the pair.
Note: The period and prices of moving averages are considered by the author on the hourly chart H1 and differs from the general definition of the classic daily moving averages on the daily chart D1.
Bollinger bands
Volatility has decreased, which does not provide signals for entering the market.
Description of indicators
- Moving average (moving average determines the current trend by smoothing out volatility and noise). Period 50. The graph is marked in yellow.
- Moving average (moving average determines the current trend by smoothing out volatility and noise). Period 30. The graph is marked in green.
- MACD indicator (Moving Average Convergence / Divergence - moving average convergence / divergence) Fast EMA period 12. Slow EMA period 26. SMA period 9
- Bollinger Bands (Bollinger Bands). Period 20
