The euro-dollar pair started the trading week almost at the same level as it did when it closed Friday's trading. Over the weekend, there were no events that would affect the mood of traders, although US President Donald Trump voiced quite loud statements – both regarding China and the progress in the fight against the coronavirus. But this rhetoric failed to provoke any market unrest, at least during the Asian session on Monday. EUR/USD traders froze in anticipation of information impulses, which will not only be from the front of the fight against the epidemic this week. The market will also respond to macroeconomic reports that will reflect the extent of the negative impact of the coronavirus.
The main macroeconomic news will come from Europe, where the ZEW, PMI, and IFO indices will be published. We will find out preliminary data for April – this is the most difficult month in terms of the epidemiological situation. It should be noted that the market is ready for negative trends, but if the real numbers are much worse than predicted, then the euro will come under strong pressure, which will allow the EUR/USD bears to take the initiative again.

In particular, the report of the center for European economic research (ZEW) will be published tomorrow, April 21. Positive dynamics are expected both in Germany and in the euro area as a whole, although the indicators will remain deep in the negative area. So, if the German index came out at -49 points in March, then it should rise to -40 in April. A dubious achievement, but the dynamics themselves are important here. If the indicator continues to decline, the euro will be under strong pressure. There are certain prerequisites for this: the coronavirus factor, the pessimistic IMF report, Lagarde's dovish rhetoric, slowing inflation, weak German data – all these circumstances can not but affect the mood of entrepreneurs. But it is worth emphasizing that if the real numbers match the forecast values, the European currency will stay afloat. Otherwise, if the downward dynamics is more extensive, the EUR/USD pair will get another reason for its decline.
An indicator of consumer confidence in the euro zone will be published on Wednesday, April 22. A negative result is also expected - a decrease to -20 points (a multi-year record) after the March decline to -11 points. Although this indicator is considered secondary, its downward dynamics will put additional pressure on EUR/USD.
Thursday will be the busiest in the context of publishing macroeconomic reports. First of all, PMI reports for key European countries will be published. If these releases repeat the expected trajectory of ZEW (i.e. a slight recovery in indicators), the euro will receive significant support. But in general, experts expect a negative trend - especially in the service sector. As for the manufacturing sector, it is also expected to slow down relative to the previous month. The very fact of a negative trend can increase bearish sentiment.
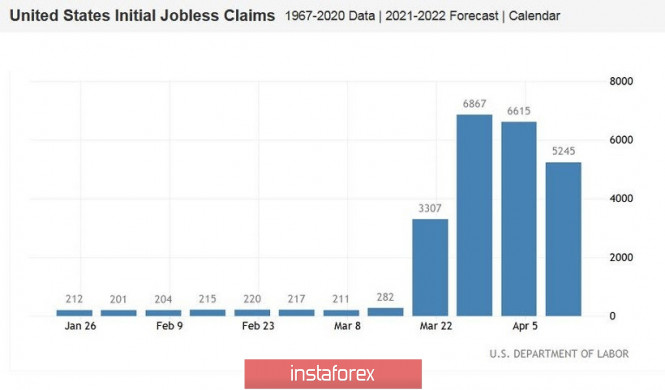
The US will also release reports on Thursday. First of all, we are talking about the growth in the number of applications for unemployment benefits. Let me remind you that this indicator has been growing at a tremendous pace for several consecutive weeks. This figure jumped to three million on March 26, then it rose to almost seven million, and it was at 6.6 million the week before last. This indicator was also expected to exceed the 6 million mark last week. But it did not do so: it came out at 5.2 million. Although such a result is not a reason for optimism, dollar bulls still retreated from positions they won. In this case, the millionth values are no longer frightening – the trend itself is important. According to the preliminary forecast, 4.5 million applications are expected this week. If the stated figures coincide with the real ones, then we can already talk about a downward trend. This fact could put pressure on the US currency, since the dollar has recently been used as the main protective asset, and its well-being depends not on the dynamics of key economic indicators, but on the level of anti-risk sentiment in the market.

Another important indicator on Thursday is the index of business activity in the US manufacturing sector. It crossed the 50-point border for the first time in many years by dropping to 48 points in March. A further decline of up to 36 points is expected in April. Bears of the EUR/USD pair will receive support only if the indicator shows a weaker result.
The final chord of the trading week will be the indices from IFO. There are also no surprises here: the decline on all fronts, however, is not as noticeable as in March (for example, the indicator of the business environment tumbled by 10 points in the previous month). In this case, traders will also track the dynamics - if at least minimal, but still growth is recorded, the EUR/USD pair will receive a reason for their correctional growth.
The pair remains bearish from a technical point of view. The price on the daily chart is located under the middle line of the Bollinger Bands indicator, under the Kumo cloud, and under all the lines of the Ichimoku indicator. However, the bears of the EUR/USD pair failed to gain a foothold below the 1.0850 mark last week, which in this case is the nearest support level. You can open short positions to the bottom of the eighth figure and to the lower line of the Bollinger Bands indicator (1.0740 mark) only if the price barrier is consolidated. The resistance level is 1.0930 (where you can place a stop loss) – if you consolidate it higher, the decline scenarios will lose their relevance.
The material has been provided by InstaForex Company - www.instaforex.com