EUR/USD
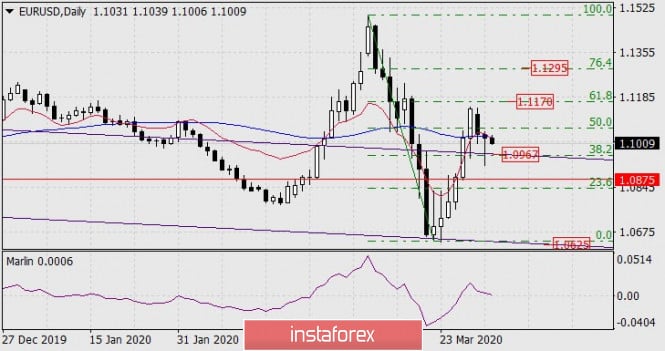
Yesterday, the euro launched an attack on the strong technical support of 1.0967, formed by the point of intersection with the line of the descending price channel and the Fibonacci level of 38.2%, as can be seen on the daily scale chart. At the same time, the price tried to gain a foothold under the MACD indicator line, but it returned to this line by the time the session ended.

Today, it opened under the MACD line and under the balance line (red indicator), which indicates the market's intention to repeat the attack at 1.0967. The signal line of the Marlin oscillator moves parallel to the boundary with the territory of the bears, waiting for a signal from the price itself.

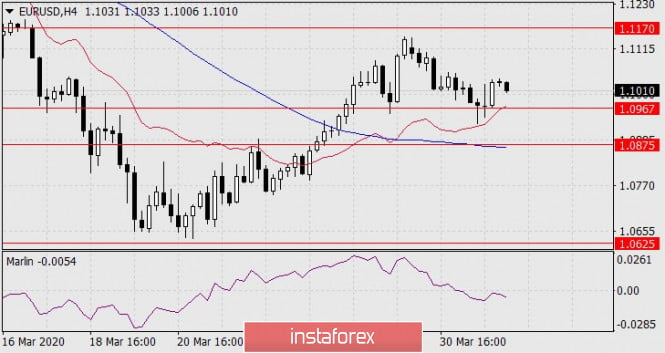
Marlin is already in the negative trend zone on the four-hour chart, while the price is kept above the balance and MACD lines. An attack pattern is created for the MACD line, that is, to the target level of 1.0875, determined at the low of October 1, 2019.
So, if yesterday's high of 1.1053 is not violated, short positions in the market can be opened with the target of 1.0875. Stop loss above 1.1053.
The material has been provided by InstaForex Company - www.instaforex.com