EUR/USD
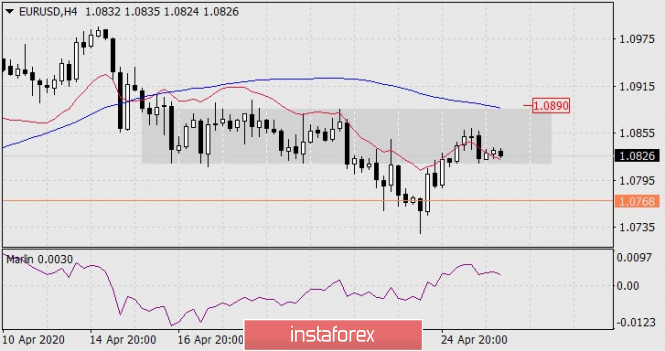
The euro traded in a range of 50 points at the end of the first day of the week, ending it with a growth of six points. Therefore, the price began to wander freely in the range of 1.0810/90, as we expected in yesterday's review. Today, the price increases the ambiguity in both scenarios by rising and falling.

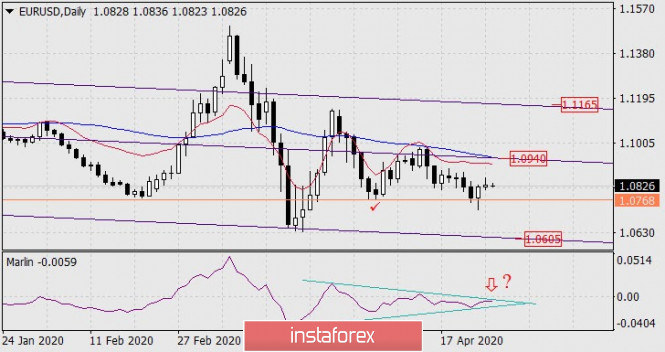
The signal line of the Marlin oscillator formed its own wedge on the daily chart, going beyond it will allow the price to work out the convergence point of the trend line with the MACD indicator line in the area of 1.0940 and even continue to grow beyond the target level. To grow further is difficult and unpredictable. there are many strong record levels on the way to the price channel line (1.1165).
In the event of a breakout of the Marlin triangle down (turning from its upper line), the movement looks more understandable, here we are waiting for the price to support the price channel in the region of 1.0605. A breakout of the indicator down is likely at the moment when the price overcomes the signal level 1.0768, which is the April 6 low.

The price is between the balance and MACD lines on the H4 chart, in the consolidation range. Moving up is possible when the price reaches the MACD line (1.0890), and the nearest target is 1.0940. A descending scenario opens with a breakout of the signal level of 1.0768. At this point, the Marlin on H4 will already be in the negative trend zone.
The material has been provided by InstaForex Company - www.instaforex.com