USD/JPY
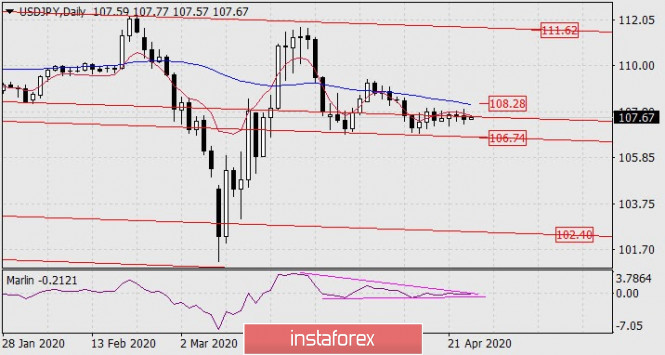
The price showed the most volatility in the last five days, although the pair ended the session with a loss of only 15 points. But this decline was enough for technical indicators to slightly turn down on the daily chart, and the price would go below the price channel line, on which it had been trading all week. The signal line of the Marlin oscillator is still within the boundaries of the wedge-shaped model, but its current value is negative, which indicates a more likely breakthrough of the indicator and price down.

After the expected breakout, the price should overcome the nearest support along the price channel and then a direct road will open to the downward trend line with a target of 102.40.

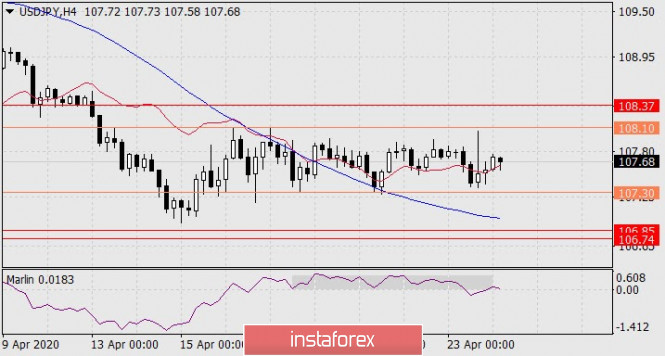
The price is moving sideways on the four-hour chart, in the uncertainty range of 107.30-108.10. The first sign of an impulsive downward movement in the near future, perhaps today, is when the Marlin signal line leaves from its own range down, and into the zone of negative values.
The first signal to open short positions will be the price moving below the signal level 107.30, the main trade will start below 106.74.
The material has been provided by InstaForex Company - www.instaforex.com