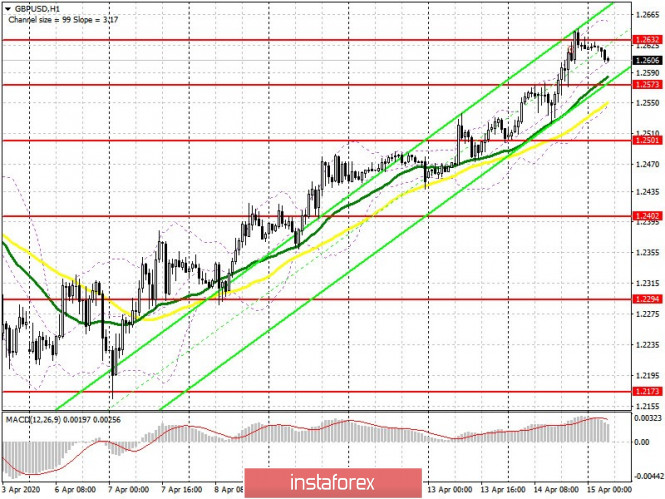
To open long positions on GBP/USD, you need:
The bulls continue to push the pair higher and higher, but there are absolutely no fundamental reasons for such a sharp purchase of the British pound, which in the end, can end very badly. Given that there is no help other than the Bank of England's daily repurchase of bonds worth 4.5 billion pounds, the further growth of the GBP/USD seems very doubtful, especially if we consider what data are waiting for us ahead. In the short term, the bulls need to return to the resistance of 1.2632, consolidating on which will be a clear signal to continue the pound's growth in order to update the new highs of 1.2686 and 1.2744, where I recommend taking profits. If the pressure on the pound returns in the first half of the day, then a false breakout in the support area of 1.2573, where the moving averages also pass, will be a signal to open long positions in the pair. I recommend postponing larger purchases until the test of the low of 1.2501.
To open short positions on GBP/USD, you need:
Sellers are not yet active, and are closely monitoring the market's reaction to the update of new highs. The first signal to open short positions in GBP/USD will be an unsuccessful consolidation above the resistance of 1.2632, which formed today in the Asian session. This scenario may cause the pound to fall to the low of 1.2573, the breakout of which will only raise the pressure on the pair and lead to a support test of 1.2501, where I recommend taking profits. If the bulls show themselves above the resistance of 1.2632, and there is no rapid movement down from this level, it is best to postpone short positions until the high of 1.2686 is updated, or sell immediately for a rebound from the resistance of 1.2744 in the calculation of an intraday downward correction of 40-50 points.

Signals of indicators:
Moving averages
Trade is conducted above 30 and 50 moving averages, which indicates the continued benefits of pound buyers.
Note: The period and prices of moving averages are considered by the author on the hourly chart H1 and differs from the general definition of the classic daily moving averages on the daily chart D1.
Bollinger bands
Growth will be limited by the upper level of the indicator at 1.2651, while the lower border at 1.2560 will provide support.
Description of indicators
- Moving average (moving average determines the current trend by smoothing out volatility and noise). Period 50. The graph is marked in yellow.
- Moving average (moving average determines the current trend by smoothing out volatility and noise). Period 30. The graph is marked in green.
- MACD indicator (Moving Average Convergence / Divergence - moving average convergence / divergence) Fast EMA period 12. Slow EMA period 26. SMA period 9
- Bollinger Bands (Bollinger Bands). Period 20
