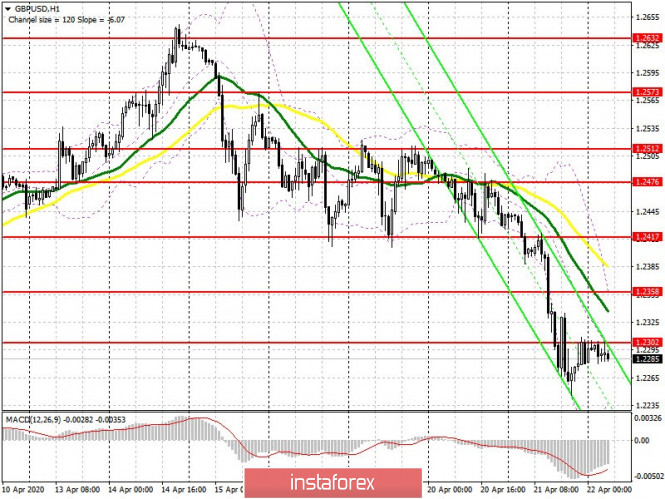
To open long positions on GBP/USD you need:
Yesterday's data on the UK labor market did not greatly impress traders, which resulted in the pound being sold. Pressure on the pair persisted during the US session. At the moment, the bulls need a return to the resistance of 1.2302, which formed today during the morning trading. Good data on inflationary pressure in the UK will allow the bulls to gain a foothold above 1.2302, which will lead to a larger upward correction to the resistance area of 1.2358 and 1.2417, where I recommend taking profits. However, one should not forget about the moving averages, which slightly goes above the resistance of 1.2358. Therefore, problems could arise with the pound's growth in the area of 1.2331. In case the pair falls further according to the trend, it is best to pay attention to a rebound from the low of 1.2229, where a divergence can also form on the MACD indicator, which will lead to a sharp increase in the pair by 30-40 points. In the absence of bullish activity, it is best to postpone pound purchases until the test of a low of 1.2173.
To open short positions on GBP/USD you need:
The primary task of the pound sellers is to form a false breakout in the resistance area of 1.2302, as well as maintaining the 1.2331 level, where the moving averages pass. Poor data on inflation in the UK could form a new sell signal, which will open a direct path for GBP/USD to the low of 1.2229, where I recommend taking profits, since most likely a bullish divergence will form on the MACD indicator. A weekly target of the bears will be a low of 1.2173. In case the pound grows above the resistance of 1.2302, and against the background of a lack of sellers even after meeting with moving averages, it is best to look at short positions only after a test of a high of 1.2358, or even higher, in a larger area of 1.2417.

Signals of indicators:
Moving averages
Trading is below 30 and 50 moving averages, which indicates the preservation of the bear market.
Note: The period and prices of moving averages are considered by the author on the hourly chart H1 and differs from the general definition of the classic daily moving averages on the daily chart D1.
Bollinger bands
In case the pair grows, the upper border of the indicator in the region of 1.2331 will act as resistance. A break of the lower border at 1.2260 will raise the pressure on the pound.
Description of indicators
- Moving average (moving average determines the current trend by smoothing out volatility and noise). Period 50. The graph is marked in yellow.
- Moving average (moving average determines the current trend by smoothing out volatility and noise). Period 30. The graph is marked in green.
- MACD indicator (Moving Average Convergence / Divergence - moving average convergence / divergence) Fast EMA period 12. Slow EMA period 26. SMA period 9
- Bollinger Bands (Bollinger Bands). Period 20
- Translation
