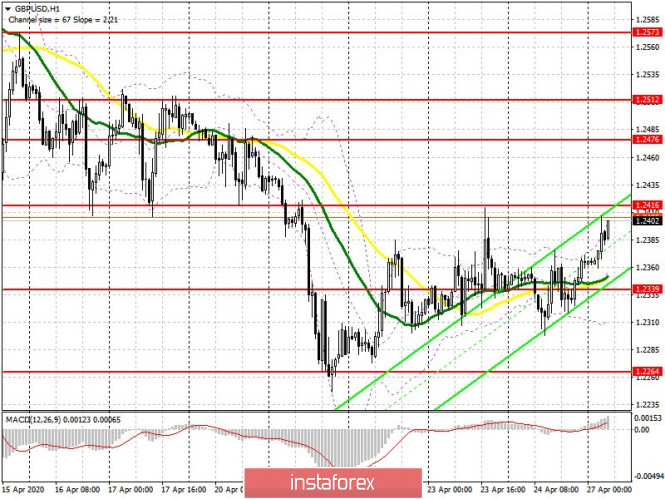
To open long positions on GBP/USD, you need:
Buyers of the pound were not frightened by data which showed a sharp decline in UK retail sales, as they won the fight for 1.2339. At the moment, while trading is above this level, we can expect growth and a test of resistance at 1.2416. However, a breakout and consolidation above this range is a more important task, which will make it possible to resume the upward trend along with a test of highs 1.2476 and 1.2512, where I recommend taking profits. In case GBP/USD returns to support 1.2339, it is best to look at long positions only after forming a false breakout at this level. I advise buying GBP/USD immediately for a rebound from a weekly low in the area of 1.2264, and then, counting on an upward correction of 30-40 points within a day.
To open short positions on GBP/USD, you need:
Pound sellers retreated from the market, allowing the bulls to approach resistance at 1.2416. The main task is to protect this level, and forming a false breakout in this range will be a signal to open short positions in order to return to the middle of the channel 1.2339. An equally important goal is to break through this range, after doing so it will be possible to open new short positions with the aim of testing the lower border of the upward correction channel 1.2264 and continuing to pull down GBP/USD to the low of 1.2173, where I advise taking profits. Under the GBP/USD growth scenario in the first half of the day, you can also return to short positions after a test of a high of 1.2476 or even higher, from a large resistance of 1.2512 counting on a correction of 30-40 points inside the day.

Signals of indicators:
Moving averages
Trade is conducted above 30 and 50 moving averages, which means preserving a small advantage for buyers.
Note: The period and prices of moving averages are considered by the author on the hourly chart H1 and differs from the general definition of the classic daily moving averages on the daily chart D1.
Bollinger bands
If the pound declines, support will be provided by the lower border of the indicator at 1.2305.
Description of indicators
- Moving average (moving average determines the current trend by smoothing out volatility and noise). Period 50. The graph is marked in yellow.
- Moving average (moving average determines the current trend by smoothing out volatility and noise). Period 30. The graph is marked in green.
- MACD indicator (Moving Average Convergence / Divergence - Moving Average Convergence / Divergence). Fast EMA period 12. Slow EMA period 26. SMA period 9.
- Bollinger Bands (Bollinger Bands). Period 20.
