To open long positions on GBP/USD, you need:
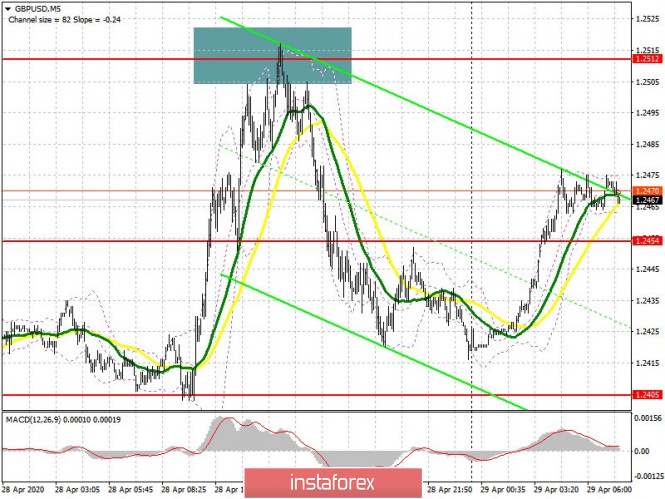
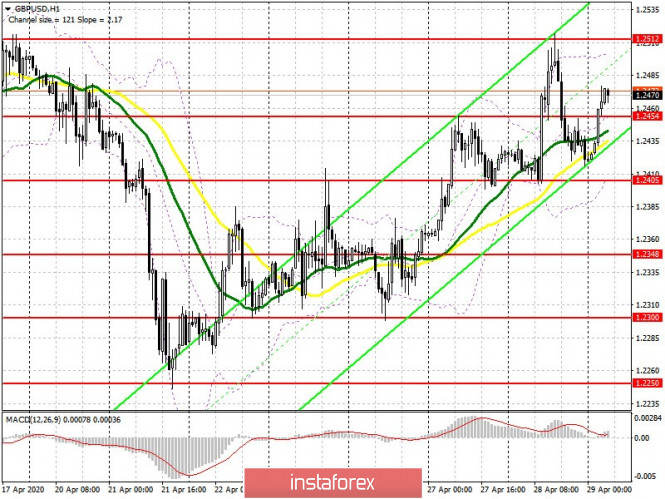
The pound's upward movement yesterday morning ended with it also being sold from the resistance level of 1.2512, from which I recommended to open short positions, which is clearly visible on the 5-minute chart. A false breakout in the resistance area of 1.2512 caused the pound to rapidly fall under the support of 1.2454, which the bulls managed to win back in the Asian session today. At the moment, while trading is conducted above this level, we can expect the pound to strengthen further, but I advise you to open long positions only after forming a false breakout in this range. An equally important task for the bulls will be to break through and update this week's highs above the 1.2512 level, and the next goal will be the resistance of 1.2512, where I recommend taking profits. In case GBP/USD declines in the first half of the day under the support of 1.2454, bears can take the market under their control. In this case, it is best to count on long positions after forming a false breakout from the support of 1.2405, or buy the pound immediately on the rebound from the low of 1.2348.

To open short positions on GBP/USD, you need:
Sellers are active with each increase in the British pound, which is clearly visible on the chart, but in order to return the market under their control, they need to consolidate below the middle of the channel 1.2454, which will be the first signal to open short positions. An equally important task for the bears is a breakout and to consolidate below the level of 1.2405, which can happen today only after a weak report on US GDP, which will return the demand for safe haven assets, thereby causing the GBP/USD to fall to the area of lows of 1.2348 and 1.2300, where I recommend taking profits. If the bulls are stronger in the first half of the day and attempt to update the highs, and this is necessary to maintain the upward trend, then short positions would be best once a false breakout is near the resistance of 1.2512, or sell the pound immediately on the rebound from 1.2573 while aiming for a correction of 30-40 points within the day. Today's Federal Reserve meeting is also important, set to take place this afternoon, as the Committee is expected to announce its decision on interest rates.

Signals of indicators:
Moving averages
Trade is conducted above 30 and 50 moving averages, which implies that buyers have a slight advantage.
Note: The period and prices of moving averages are considered by the author on the hourly chart H1 and differs from the general definition of the classic daily moving averages on the daily chart D1.
Bollinger bands
If the pound declines, support will be provided by the lower border of the indicator at 1.2405. Growth will be limited by the upper level of the indicator at 1.2512.
Description of indicators
- Moving average (moving average determines the current trend by smoothing out volatility and noise). Period 50. The graph is marked in yellow.
- Moving average (moving average determines the current trend by smoothing out volatility and noise). Period 30. The graph is marked in green.
- MACD indicator (Moving Average Convergence / Divergence - moving average convergence / divergence) Fast EMA period 12. Slow EMA period 26. SMA period 9
- Bollinger Bands (Bollinger Bands). Period 20
