To open long positions on GBP/USD, you need:
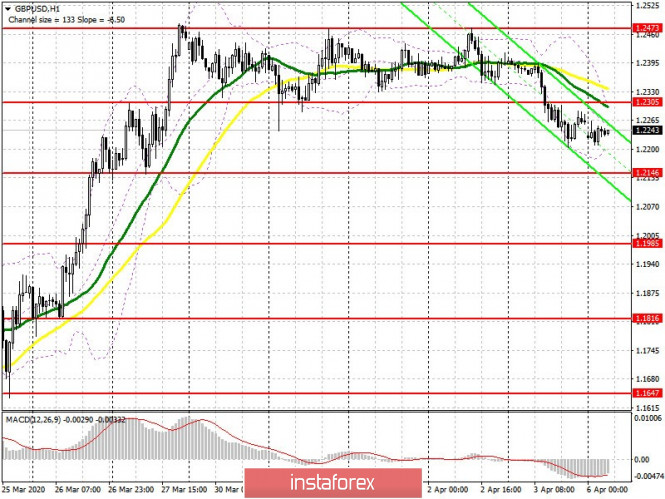
Released at the end of last week, data on a sharp increase in the number of people employed in the non-agricultural sector by more than 700,000 did not put much pressure on the US dollar, but led to a decrease in the GBP/USD pair, which was trading in a side channel throughout the week. The bears managed to gain a foothold and protect the level of 1.2315, which has now transformed into the resistance of 1.2305. Today, buyers in the first half of the day need to urgently return the pair back to the level, since it will be possible to retain the advantage in this scenario. If the GBP/USD continues to decline, and most likely it will, then it is best to return to long positions only after the support test of 1.2146, provided that a false breakout is formed there, or a rebound from the larger low of 1.1985, in the expectation of a correction of 60-70 within the day. A breakout and consolidation above the resistance of 1.2315 will push purchases to the highest area of 1.2473, where I recommend taking profits.
To open short positions on GBP/USD, you need:
The bears coped with the weekly task and returned the pair to the 1.2315 level. Today, you can return to short positions after an upward correction to the resistance of 1.2305, provided that a false breakout is formed there, which will be a signal to open new short positions in order to update the larger lows of 1.2146 and 1.1985, where I recommend taking profits. If the bears prefer to retreat again, as evidenced by the lack of active sales after a false breakout in the resistance area of 1.2305, then I recommend returning to short positions only for a rebound from last week's high in the 1.2473 area.

Signals of indicators:
Moving averages
Trading is conducted below 30 and 50 moving average, which indicates the preservation of the bearish scenario in the short term.
Note: The period and prices of moving averages are considered by the author on the hourly chart H1 and differs from the general definition of the classic daily moving averages on the daily chart D1.
Bollinger bands
A break of the upper boundary of the indicator in the region of 1.2305 will lead to a larger growth of the pound. Breakout of the lower boundary in the region of 1.2215 will increase the pressure on the pair.
Description of indicators
- Moving average (moving average determines the current trend by smoothing out volatility and noise). Period 50. The graph is marked in yellow.
- Moving average (moving average determines the current trend by smoothing out volatility and noise). Period 30. The graph is marked in green.
- MACD indicator (Moving Average Convergence / Divergence - moving average convergence / divergence) Fast EMA period 12. Slow EMA period 26. SMA period 9
