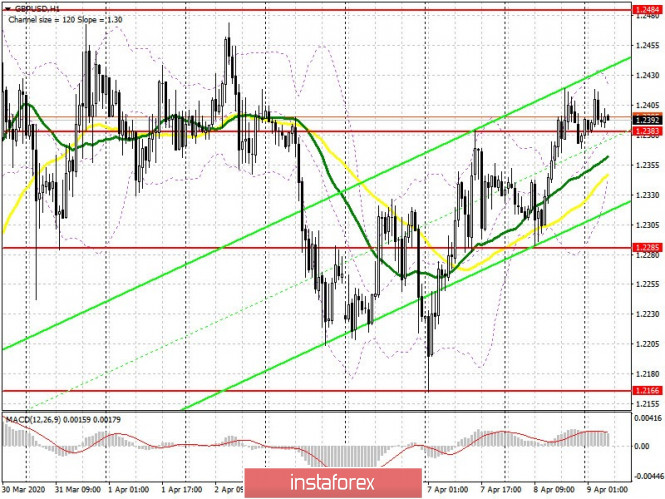
To open long positions on GBP/USD, you need:
Buyers of the British pound coped with the task and returned the pair to the middle of a wide side channel of 1.2383, but no one seems to know what to do next. Most likely, traders will wait for reports on the state of the UK economy in February this year, but they are unlikely to change the situation. I advise you to return to long positions only after the downward correction of the pound in the area of the lower border of the channel 1.2285, or buy immediately on the rebound from the weekly low of 1.2166. We can talk about buying when a false breakout forms in the area of a mid-channel 1.2383, but keep in mind the fact that this range could be "spread out" in current conditions of uncertainty with direction, and short stop orders for such market entry is unlikely to be suitable. An equally important task for the bulls will be to update the resistance at 1.2484, where I recommend taking profits. More persistent players will count on a breakthrough of this resistance and update the highs of 1.2605 and 1.2686.
To open short positions on GBP/USD, you need:
Sellers of the pound need to quickly rehabilitate after yesterday's "lull" in the resistance area of 1.2383. A return and consolidation under this level, along with poor data on the UK GDP growth rate in February this year, will lead the pair's decline to the support area of 1.2285. A break of this level will sharply pull down the GBP/USD to a weekly low in the 1.2166 area, where I recommend taking profits. In case the pair grows further, it is best to return to short positions from the upper boundary of the side channel of 1.2484, but you can sell the pound immediately on the rebound from the high of 1.2484, with the aim of correcting 40-50 points within the day. News of the deteriorating health of British Prime Minister Boris Johnson, who remains in intensive care, may also put pressure on the British pound.

Signals of indicators:
Moving averages
Trade is conducted in the range of 30 and 50 moving averages, which indicates market uncertainty in the short term.
Note: The period and prices of moving averages are considered by the author on the hourly chart H1 and differs from the general definition of the classic daily moving averages on the daily chart D1.
Bollinger bands
A break of the upper border of the indicator at 1.2420 will lead to a larger growth of the pound. Breakdown of the lower boundary in the region of 1.2355 will increase the pressure on the pair.
Description of indicators
- Moving average (moving average determines the current trend by smoothing out volatility and noise). Period 50. The graph is marked in yellow.
- Moving average (moving average determines the current trend by smoothing out volatility and noise). Period 30. The graph is marked in green.
- MACD indicator (Moving Average Convergence / Divergence - moving average convergence / divergence) Fast EMA period 12. Slow EMA period 26. SMA period 9
- Bollinger Bands (Bollinger Bands). Period 20
