4-hour timeframe

Average volatility over the past 5 days: 79p (average).
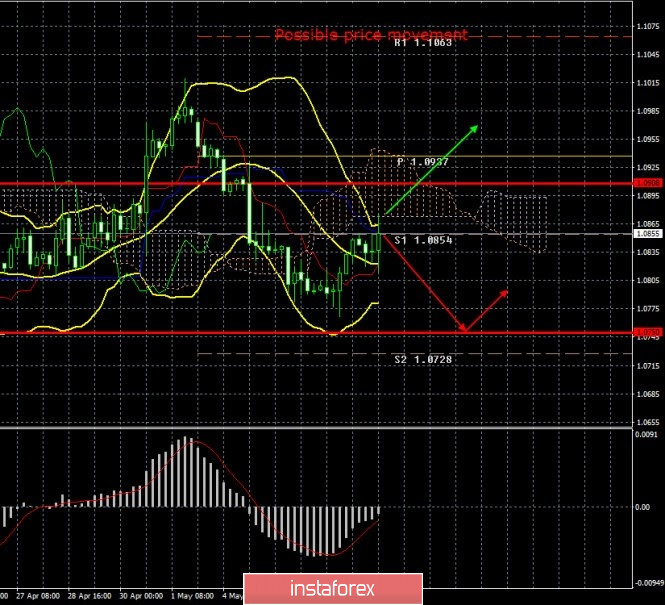
The EUR/USD currency pair continued its corrective movement on the last trading day of the week, which it started the day before. However, it can be considered corrective in relation to the "dead cross" from the Ichimoku indicator. In General, we continue to believe that the pair's quotes continue to consolidate in the 250-point side channel, limited by the levels of 1.1000 and 1.0750. Since yesterday there was a rebound from the lower border of this channel. Today, the upward movement continued. During the day, the pair managed to work out the critical Kijun-sen line, but we expect movement to the upper border of the channel, that is, to the psychological level of $1.10. Thus, with a high probability, the Senkou Span B and Kijun-sen lines will be overcome. If a rebound does occur, traders may try to resume the downward movement, but we do not expect a new trend to form until the lower border of the side channel is overcome.
The macroeconomic background of today would normally trigger a surge in volatility. And if we take into account the value of the indicators published on May 8, we could expect a 200 or 300-point movement. However, now the logic of traders is completely different. The vast majority of reports continue to be ignored. With grief in half yesterday, market participants found the strength to react at least a little to the results of the meeting of the Bank of England, and even then, this event and the market reaction did not concern the euro/dollar pair. On March 8, the most important indicators of the state of the economy were published in the United States. Let's start with the positive news. The level of average wages in April unexpectedly increased by 7.9% on an annual basis and by 4.7% on a monthly basis. This is an absolutely record increase over the past 25 years, that is, for the period of time for which statistics are available at all. Before that, the annual growth rate did not exceed one percent. However, even in the morning articles, we said that the report on wages is now far from the most significant, or rather completely unimportant because, in a collapsing economy, the increase in wages means little. Especially with unemployment rising by giant leaps. It was the unemployment rate that was published as the second, and all the positive news for the US dollar ended on the first report. The official unemployment rate rose in April to 14.7%, while hidden unemployment increased to 22.8% with a forecast of 11.2%. Recall that hidden unemployment takes into account not only those who have lost their jobs and can not find a new one but also those who are dissatisfied with their current job and can not find a new one. Thus, the numbers are already huge, and by the end of May, they may become even worse. Donald Trump, of course, is slowly starting to open up the US economy, and quarantine measures are gradually easing in some states, but it is still very early to talk about a full restart. In any case, the rate of applications for unemployment benefits is growing, which means that people continue to be dismissed from their jobs. The last indicator published was Nonfarm Payrolls, which is usually one of the most important indicators. Minus 20.5 million jobs outside the agricultural sector. This indicator has never seen such values. However, in previous articles, we have already said that traders are unlikely to be surprised by such failed values of unemployment and Nonfarm Payrolls. This is because recent similar publications have already formed an impression of the current state of the US economy. Thus, traders were absolutely not surprised by the 20.5 million minus jobs. Most of the day, the euro/dollar pair stood in one place and continued to move up only in the US session. Thus, we can assume that market participants still reacted to the publication of reports. However! In total, the pair passed 55 points in 4 hours of the American session, and the final fall of the dollar during this time was about 20 points. If this is called the market reaction to three such important reports, then...
At the same time, many media outlets and periodicals said today that the new trade war between the United States and China is being canceled. A "loud" headline that has nothing to do with reality. What happened was that US Treasury Secretary Steven Mnuchin, trade representative Robert Lighthizer, and Chinese Vice Premier Liu He held a telephone conversation in which they agreed to "expand favorable conditions for the implementation of the first phase of the deal." What this means in practice is unknown. The parties only noted that cooperation in the field of health and macroeconomics can be expanded. And here comes the most interesting question: what is the opinion of Donald Trump or Mike Pompeo, who in the past few weeks has accused China of all the deadly sins and, especially, of spreading the "coronavirus", of its deliberate creation in the laboratory, of misinformation around the world, which has led to the infection of more than 3.5 million people (and this is only according to official information). Donald Trump promised to present evidence of China's guilt in the coming weeks and promised to impose new trade duties if China does not compensate America. Mike Pompeo claimed to have seen documents proving Beijing's guilt with his own eyes. However, then the chief epidemiologist of the countries Anthony Fauci said that the virus is unlikely to be the work of man, and according to American intelligence, there is no evidence of deliberate spread of the virus by China or its creation in the laboratory. However, both Pompeo and Trump continued to give identical interviews. Thus, the top US officials either did not agree among themselves, or we should expect new information from Trump in the near future, who can easily say that the evidence has been found and now China must compensate the United States, otherwise – a new trade war.
4-hour timeframe

Average volatility over the past 5 days: 106p (high).
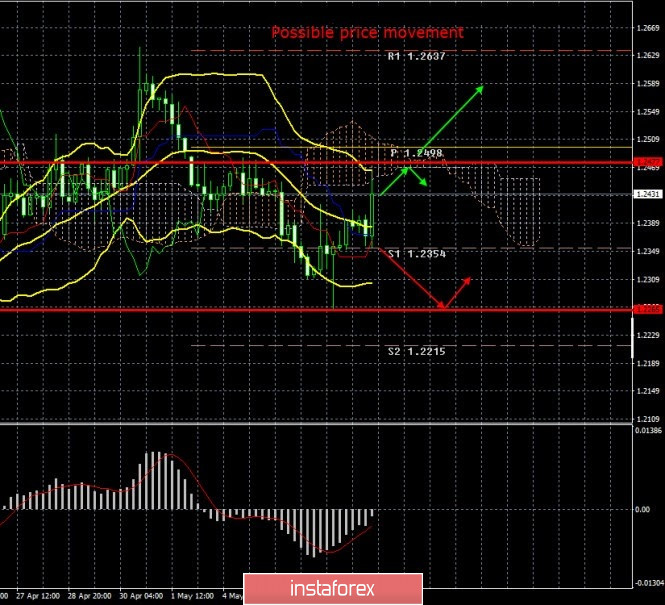
The GBP/USD currency pair also continued its correction movement on May 8, which also started after a rebound from the lower border of the side channel. Thus, in the case of the British pound, we now expect a move up to the upper border of the channel – around the level of 1.2650. The Kijun-sen line was successfully crossed today, so the sell signal is already weakened. The pair has worked out the Senkou Span B line and will most likely finish trading this week, and a new upward movement can be expected as early as next week. As in the case of the euro currency, the concept of correction is now relative, as the pair continues to consolidate within the 400-point side channel. Thus, we do not recommend counting on the formation of a downward trend until the price is fixed below its lower line, the area of 1.2200-1.2250.
Recommendations for EUR/USD:
For short positions:
On the 4-hour timeframe, the EUR/USD pair continues to adjust. Thus, it is recommended to consider new sales of the euro currency with targets in the range of 1.0750-1.0740 in the event of a price rebound from the Kijun-sen line. Overcoming this range will allow you to keep open sell positions with the goal of 1.0717.
For long positions:
Long positions will become relevant with the target resistance level of 1.1063, when the price will be fixed above the Kijun-sen and Senkou Span B lines.
Recommendations for GBP/USD:
For short positions:
The pound/dollar pair also continues to adjust. Thus, traders are recommended to sell the pair with targets of 1.2265 and 1.2215 if the quotes return to the area below the critical line.
For long positions:
Purchases of the GBP/USD pair can be considered now with the goals of 1.2477 and 1.2498, but in small lots, since there is not even a buy signal from Ishimoku yet.
Explanation of the illustrations:
Ichimoku Indicator:
Tenkan-sen - red line.
Kijun-sen - blue line.
Senkou Span A - light brown dotted line.
Senkou Span B - light purple dotted line.
Chinkou Span - green line.
Bollinger bands indicator - 3 yellow lines.
The MACD indicator is a red line and a histogram with white bars in the indicator window.
Support/resistance levels are classic - red and gray dotted lines with price symbols.
Pivot level - yellow solid line.
Volatility levels - solid red lines.
Possible variants of the price movement:
Red and green arrows.
The material has been provided by InstaForex Company - www.instaforex.com