To open long positions on EURUSD, you need:
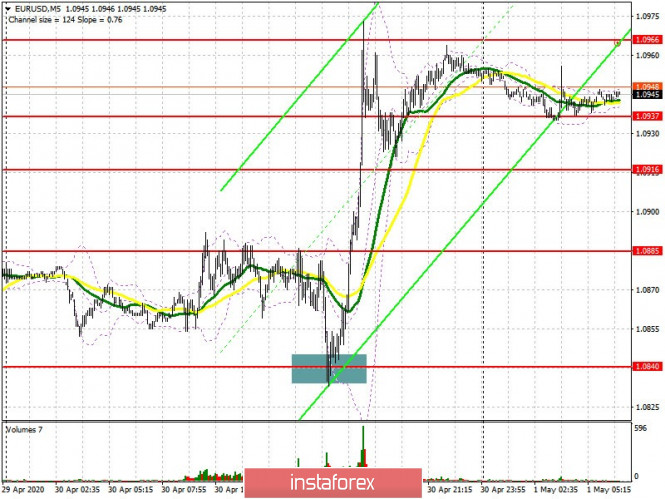
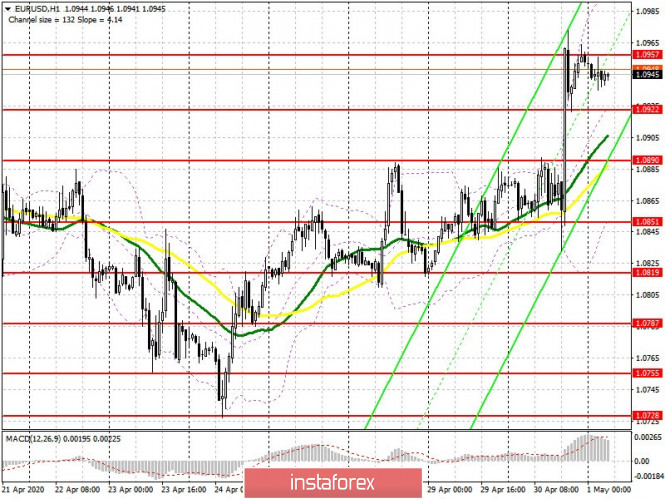
In my review yesterday, I advised you to open long positions when the pair declines to a major support in the area of 1.0840. If you look at the 5-minute chart, you will see how a false breakout was formed there, after which the euro started to sharply grow. Those who did not have time to buy in the 1.0840 area could easily do so after the breakout and then consolidate above the 1.0885 resistance. At the moment, the task of the bulls is to break through and consolidate above the resistance of 1.0957, which will quickly lead the pair to a new high of 1.0990, with growth above which there could be problems, since it is likely to form a divergence on the MACD indicator. Many European markets will be closed today due to the celebration of May 1, so the volatility may be quite low in the first half of the day. In case the EUR/USD falls since there are no important fundamental data, it is best to return to long positions only on a false breakout in the support area of 1.0922, or buy the euro immediately on a rebound from the low of 1.0890.

To open short positions on EURUSD you need:
The bears managed to return to the market after an update of major resistance at 1.0965, from which I advised opening short positions in the afternoon. Today, sellers need to regain control over the market. There is a probability of forming a false breakout in the resistance area of 1.0957, and forming a divergence on the MACD indicator in the resistance area of 1.0990, from where you can open short positions immediately on the rebound. An equally important task for the bears is to break through and consolidate below the 1.0922 support. If euro buyers are not active, then bears have a chance to completely regain the current bullish momentum today, so I advise increasing short positions after consolidating below the range of 1.0922 in the hope of pulling down EUR/USD to the lows of 1.0890 and 1.0851 and returning the pair to the side channel from which it left yesterday.

Signals of indicators:
Moving averages
Trading is conducted above 30 and 50 moving averages, which implies maintaining the bullish momentum.
Note: The period and prices of moving averages are considered by the author on the hourly chart H1 and differs from the general definition of the classic daily moving averages on the daily chart D1.
Bollinger bands
Growth could be limited by the upper level of the indicator in the region of 1.0990. In case the euro falls, the lower border of the indicator will provide support around 1.0875.
The material has been provided by InstaForex Company - www.instaforex.com