To open long positions on EUR/USD, you need:
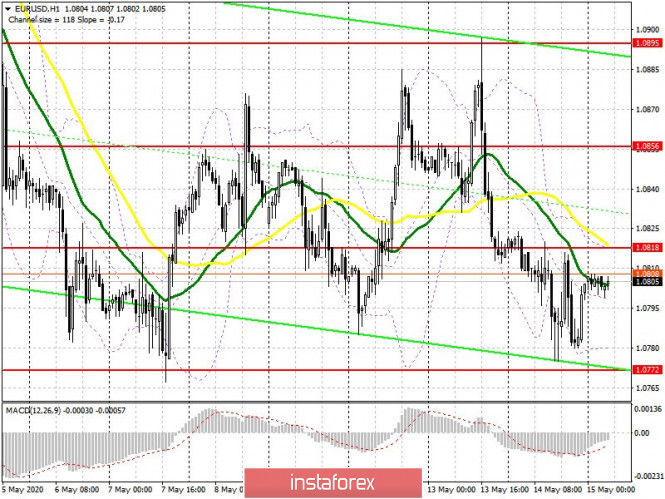
Yesterday's report on the US labor market did not result in a serious surge in volatility, and the bulls did not manage to get past the highs of the day and continue the upward correction against the US dollar. The buy signal, which I discussed in detail in the forecast for the second half of the day, also did not bring the expected profit, as the pair remained in the side channel. Important reports on the GDP of Germany and the eurozone are now expected in the first half of the day, which could result in a breakthrough and consolidation above the 1.0818 level, as well as continuing the euro's growth in the area of 1.0856. The long-term goal will be the high of 1.0895, where I recommend taking profits. Another important task is to support 1.0772, where forming a false breakout in the first half of the day will be a signal to buy the euro. Otherwise, in case of worse eurozone data than economists expect, it is best to consider buying the euro from the low of 1.0728, or open long positions immediately on a rebound from the support of 1.0636 while expecting a correction of 30-40 points within the day.
To open short positions on EUR/USD, you need:
Sellers will retain control of the intermediate resistance area of 1.0818, where they will try to form a false breakout in the first half of the day, which will lead to maintaining pressure on the euro and pulling down the pair to the lower border of the side channel of 1.0772. The further direction of the market will depend on the breakout of this level. If the bears manage to gain a foothold below this range after weak fundamental statistics for Germany and France, it is likely that sales will increase, which will lead to a test of the lows of 1.0728 and 1.0636, where I recommend taking profits. If a critical downward movement from the resistance of 1.0818 does not happen in the first half of the day, it is best to defer short positions to test the high of 1.0856, or even to sell directly to the rebound from the resistance 1.0895 based on a correction of 30-35 points within the day.

Signals of indicators:
Moving averages
Trade is conducted in the region of 30 and 50 moving average, which indicates the lateral nature of the market.
Note: The period and prices of moving averages are considered by the author on the hourly chart H1 and differs from the general definition of the classic daily moving averages on the daily chart D1.
Bollinger bands
A break of the upper border of the indicator in the region of 1.0818 will cause the euro to sharply grow. Pressure on the euro will be limited by the lower border of the indicator at 1.0780.
Description of indicators
- Moving average (moving average determines the current trend by smoothing out volatility and noise). Period 50. The graph is marked in yellow.
- Moving average (moving average determines the current trend by smoothing out volatility and noise). Period 30. The graph is marked in green.
- MACD indicator (Moving Average Convergence / Divergence - Moving Average Convergence / Divergence) Fast EMA period 12. Slow EMA period 26. SMA period 9
- Bollinger Bands (Bollinger Bands). Period 20
