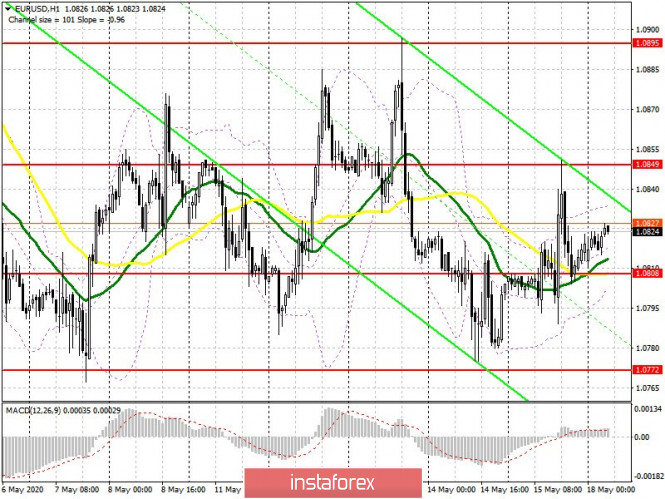
To open long positions on EUR/USD, you need:
Friday's data on the collapse of retail sales in the US did not result in a major strengthening of the European currency, and did not return the demand for the US dollar, only boosting the faith of investors in the need to buy gold. The current task of the bulls is to keep the 1.08 level, which was formed at the end of last week and also, forming a false breakout will be a signal for opening long positions based on a return and breakthrough of resistance 1.0849. This scenario will result in a larger upward wave in the area of highs 1.0895 and 1.0923, where I recommend taking profits. If there are no active actions in the support area of 1.08, it is best to postpone long positions in the euro until the test of a low of 1.0772, or buy immediately on the rebound from the larger support of 1.0728, since due to the lack of good news, the pressure on the market can return at any time.
To open short positions on EUR/USD, you need:
Sellers need to regain control of the 1.0808 level, consolidating below which will be a good signal to open short positions while expecting another decline in the area of the lower border of the 1.0772 side channel, which formed on May 7. A breakdown of this area will quickly pull down the euro to the lows of 1.0728 and 1.0636, where I recommend taking profits. If the bulls try to return to the market in the first half of the day, then an unsuccessful attempt to update last Friday's high in the area of 1.0849 will be a signal to open short positions. It is best to sell EUR/USD immediately for a rebound after testing the highs of 1.0895 1.0923, counting on a correction of 30-35 points within the day.

Signals of indicators:
Moving averages
Trade is conducted in the region of 30 and 50 moving average, which indicates the lateral nature of the market.
Note: The period and prices of moving averages are considered by the author on the hourly chart H1 and differ from the general definition of the classic daily moving averages on the daily chart D1.
Bollinger bands
Volatility has decreased. A break of the lower border of the indicator in the region of 1.0805 will increase pressure on the euro, which will result in another wave of decline in the pair. Bulls should not have problems with growth above the upper boundary of the indicator in the area of 1.0830.
Description of indicators
- Moving average (moving average determines the current trend by smoothing out volatility and noise). Period 50. The graph is marked in yellow.
- Moving average (moving average determines the current trend by smoothing out volatility and noise). Period 30. The graph is marked in green.
- MACD indicator (Moving Average Convergence / Divergence - moving average convergence / divergence) Fast EMA period 12. Slow EMA period 26. SMA period 9
- Bollinger Bands (Bollinger Bands). Period 20
