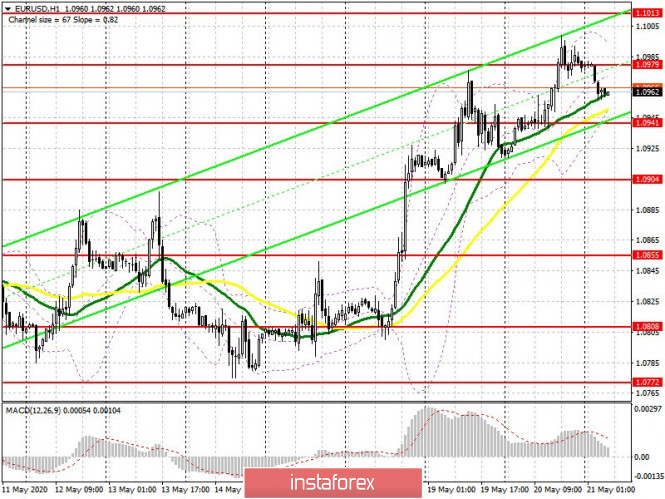
To open long positions on EUR/USD, you need:
The European currency continued to grow against the US dollar yesterday afternoon, following good data on the eurozone consumer sentiment index, which has slightly grown from its negative values. The bulls even tried to maintain a bullish momentum before the release of the Federal Reserve's minutes on the top-down test of the 1.0972 level, but nothing good came of it, and so the bears regained this level at the Asian session, forming a new resistance of 1.0979. Now the main task of euro buyers is to break through and consolidate above this range, which will lead to a new wave of growth and preservation of the upward trend with a test of the high of 1.1013 and also with an update of a larger resistance of 1.1093, where I recommend taking profits. If pressure on EUR/USD persists in the first half of the day, then the bulls will show themselves after updating the 1.0941 level, but I recommend buying from there only after forming a false breakout. It is best to open long positions immediately for a rebound after a test of a low of 1.0904, counting on a correction of 25-30 points within a day.
To open short positions on EUR/USD, you need:
Pressure on the European currency may intensify today in the morning after the release of reports on PMI indices for the services and manufacturing sectors of the eurozone countries. Poor indicators will lead to forming a false breakout in the resistance area of 1.0979, which will be a signal to open short positions in order to pull down as well as a breakdown of the support of 1.0941, consolidating below which will quickly pull down EUR/USD to the lows of 1.0904 and 1.0855, where I recommend taking profit. In case the euro grows above resistance 1.0979, it is best to postpone short positions until the high of 1.1013 is updated, the test of which can only strengthen the bulls' faith in further growth, therefore, you can sell for a rebound from this range, but subject to a higher short stop order. Larger players will return to the market only from a high of 1.1093.

Signals of indicators:
Moving averages
Trading is slightly higher than 30 and 50 moving averages, which indicates a slowing of the bullish momentum.
Note: The period and prices of moving averages are considered by the author on the hourly chart H1 and differs from the general definition of the classic daily moving averages on the daily chart D1.
Bollinger bands
A break of the lower border of the indicator in the region of 1.0941 will increase pressure on the euro, which will result in the pair's decline. Growth will be limited by the upper level of the indicator in the area of 1.1000.
Description of indicators
- Moving average (moving average determines the current trend by smoothing out volatility and noise). Period 50. The graph is marked in yellow.
- Moving average (moving average determines the current trend by smoothing out volatility and noise). Period 30. The graph is marked in green.
- MACD indicator (Moving Average Convergence / Divergence - Moving Average Convergence / Divergence) Fast EMA period 12. Slow EMA period 26. SMA period 9
- Bollinger Bands (Bollinger Bands). Period 20
- Send feedba
