To open long positions on EUR/USD, you need:
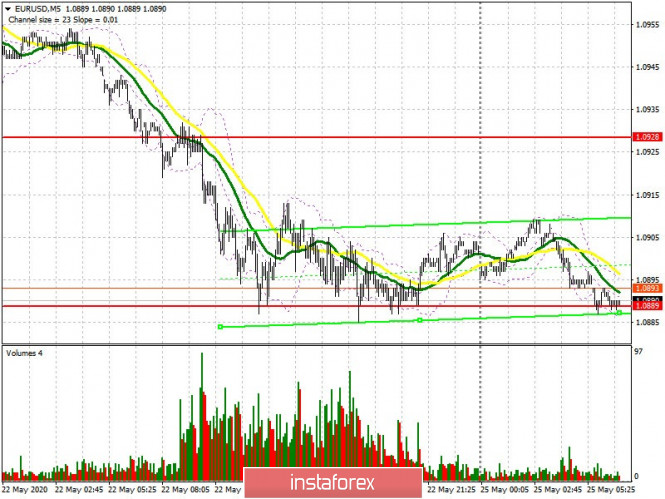
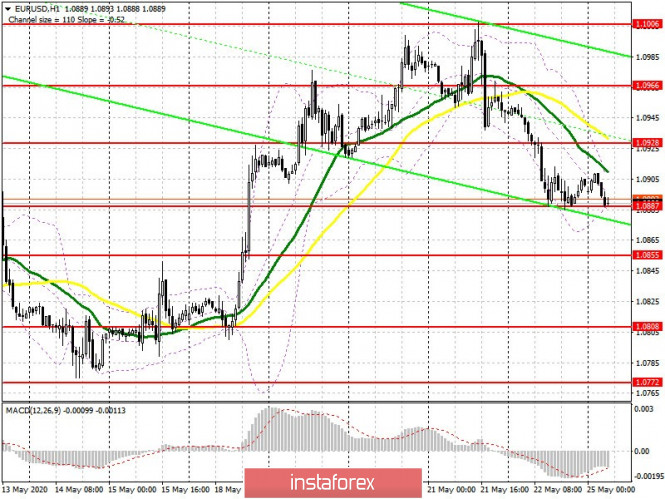
I drew attention to the 1.0889 level in my forecast for Friday afternoon, which has already been tested by the bears and on which the pair's further direction depended. If you look at the 5-minute chart, you will see how the bears failed to break below this range from the second test, which led to forming a false breakout and a slight rebound upward. However, a larger upward momentum could not form from there. At the moment, bulls still need to defend support 1.0887, and forming the next false breakout there will be a signal to open long positions. Otherwise, I recommend buying EUR/USD now only for a rebound from a low of 1.0855. An equally important task for the bulls is the return of EUR/USD to the resistance of 1.0928, where the moving averages also pass. Whether the upward trend will continue or not will depend on this. Consolidating above this range, along with good data on the German economy, or rather, according to expectations from the IFO, can lead to a breakthrough and consolidation above this range, which will open a direct path to the highs of 1.0966 and 1.1006, where I recommend taking profits.

To open short positions on EUR/USD, you need:
Bears are taking advantage of the news that the European Central Bank may increase the asset buyback program at its June meeting despite the confrontation between Germany and other Nordic countries on this issue. The bears need to consolidate below the support of 1.0887, which will lead to a further downward correction of EUR/USD already in the area of lows 1.0855 and 1.0808, where I recommend taking profit. However, do not forget that the IFO will release reports on the German economy today, which may contain sufficient positive data, which could slightly strengthen the euro in the morning. In this scenario, I advise you to postpone short positions until the resistance of 1.0928 is updated and a false breakout has formed there, which will be the first sell signal. In the absence of activity among bears at this level, it is best to wait for a test of a high of 1.0966 and sell the euro from there immediately for a rebound while expecting a correction of 30-40 points within a day.

Signals of indicators:
Moving averages
Trade is conducted below 30 and 50 moving averages, which indicates a possible further decline in the euro.
Note: The period and prices of moving averages are considered by the author on the hourly chart H1 and differs from the general definition of the classic daily moving averages on the daily chart D1.
Bollinger bands
A break of the lower border of the indicator in the region of 1.0887 will increase pressure on the euro, which will lead to another wave of decline in the pair. A break of the upper boundary in the area of 1.0905 will lead to a more powerful strengthening of the pair.
Description of indicators
- Moving average (moving average determines the current trend by smoothing out volatility and noise). Period 50. The graph is marked in yellow.
- Moving average (moving average determines the current trend by smoothing out volatility and noise). Period 30. The graph is marked in green.
- MACD indicator (Moving Average Convergence / Divergence - Moving Average Convergence / Divergence) Fast EMA period 12. Slow EMA period 26. SMA period 9
- Bollinger Bands (Bollinger Bands). Period 20
