USD/JPY
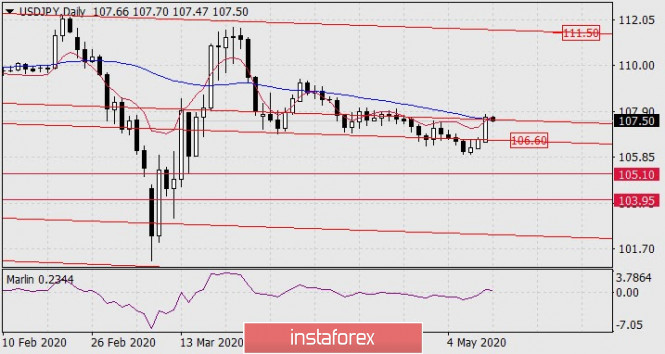
The USD/JPY pair grew by 100 points on Monday amid the general strengthening of the dollar, uncertain stock market growth and optimism of investors on the occasion of the easing of quarantine in Europe and the US. The price reached the embedded line of the price channel and the MACD indicator line at their intersection on the daily chart, which is a strong technical resistance.

The unfavorable situation in the stock market itself could be the reason for the price reversal. US indices closed mixed yesterday: S&P 500 0.01%, Dow Jones -0.45%, Nasdaq 0.78%, Russell 2000 -0.32%. The S&P 500 hit its highest growth on April 29 and has yet to overcome it. In the Asian session, Nikkei 225 loses -0.30%. Obviously, for confident purchases of the USD/JPY currency pair while aiming for 111.50, you should wait for the S&P 500 to leave the area above the April 29 high of 2954.86. The quote closed at 2930.19 on Monday.
The signal line of the Marlin Oscillator is slightly above the border with the growth territory. In case of a relatively small "crouch" of the price, Marlin can return to the negative zone, which will serve as the basis for the price to return to 106.60.

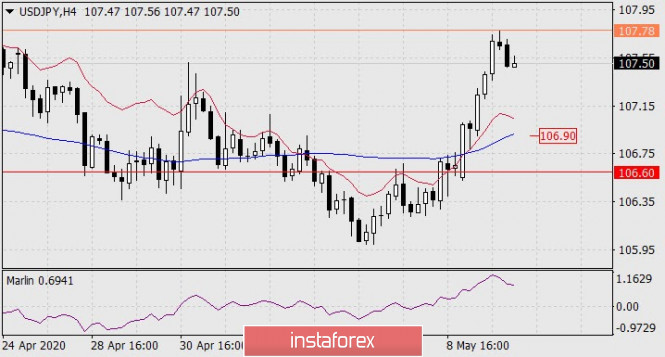
The situation is completely increasing on the four-hour chart: the price is above the indicator lines, Marlin is in the growth zone. A condition for a decline will be for the price to decrease to 106.90 at the MACD line. There are no signs of a reversal on H4, but they are on the daily chart.
As a result, we have to wait - directly on the price chart, you need to wait for the exit to go up, above 107.78, or down to 106.90. And the price exit above 107.78 must be accompanied by overcoming the April 29 high in the stock market.
The material has been provided by InstaForex Company - www.instaforex.com