To open long positions on GBP/USD, you need:
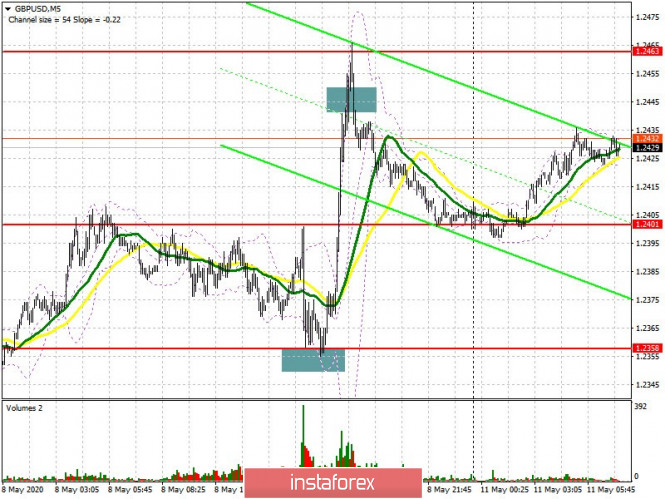
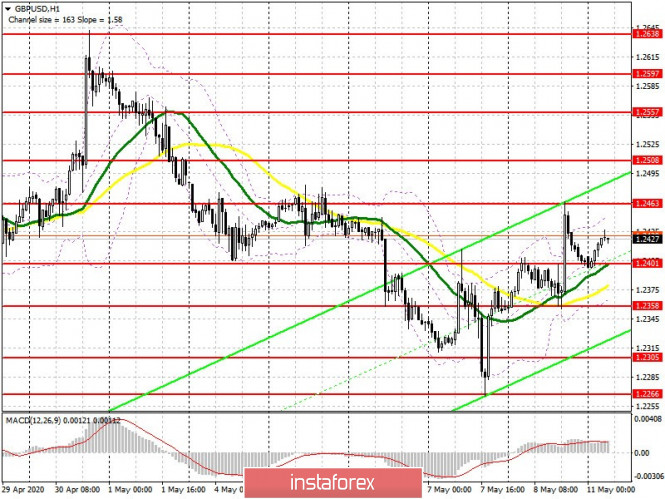
Last week, I paid attention to purchases in the support area of 1.2356, which enabled me to take more than 100 points from the market after the release of a report indicating a reduction in US jobs by more than 20 million. The data turned out to be better than economists' forecasts, which did not lead to a serious sell-off of GBP/USD and retained optimism in the market, which may affect the further strengthening of the pound. If you look at the 5-minute chart, you can see that after purchases in the 1.2356 area, growth slowed down in the 1.2445 area, from where I recommended to open short positions, which also led to a downward correction of the pair by around 40 points at the end of the day. Currently, pound buyers have a chance to continue the upward correction, however, it is necessary to use the 1.2463 level. Consolidating on this range will be a signal to open long positions, counting on updating larger highs in the areas of 1.2508 and 1.2557, where I recommend taking profits. Also, a good entry would be forming a false breakdown in the support area of 1.2401, just below which the moving averages also pass. However, if there is no activity on the part of the bulls, it is best to postpone purchases until the test low of 1.2358, or open long positions immediately on the rebound from support 1.2305, counting on an upward correction of 30-40 points within the day.

To open short positions on GBP/USD, you need:
Sellers will protect the resistance at 1.2463, by analogy, as it was last Friday with the 1.2445 level. Forming a false breakdown at this level in the morning will be a signal to open short positions in order to fall to the support of 1.2401. It is worth paying attention to the quick movement down from the 1.2463 level, since in the absence of activity on the part of the bears, GBP/USD may continue to grow. In this case, it is best to return to short positions after testing the highs of 1.2508 and 1.2557, counting on a downward correction of 30-40 points within a day. An equally important task for sellers will be to break through and consolidate below 1.2401 support, around which the moving averages also pass. This will increase the pressure on the pair and lead to the renewal of last week's lows in the areas of 1.2305 and 1.2266, where I recommend taking profits.

Signals of indicators:
Moving averages
Trading is conducted above 30 and 50 moving average, which indicates the likelihood of forming an upward correction.
Note: The period and prices of moving averages are considered by the author on the hourly chart H1 and differs from the general definition of the classic daily moving averages on the daily chart D1.
Bollinger bands
A break of the upper border of the indicator at 1.2455 will result in a new bullish momentum. In case the pair falls, you can buy from its lower border indicator in the region of 1.2360.
Description of indicators
- Moving average (moving average determines the current trend by smoothing out volatility and noise). Period 50. The graph is marked in yellow.
- Moving average (moving average determines the current trend by smoothing out volatility and noise). Period 30. The graph is marked in green.
- MACD indicator (Moving Average Convergence / Divergence - moving average convergence / divergence) Fast EMA period 12. Slow EMA period 26. SMA period 9
- Bollinger Bands (Bollinger Bands). Period 20
